表格
限定名称: manim.mobject.table.Table
- class Table(table, row_labels=None, col_labels=None, top_left_entry=None, v_buff=0.8, h_buff=1.3, include_outer_lines=False, add_background_rectangles_to_entries=False, entries_background_color=ManimColor('#000000'), include_background_rectangle=False, background_rectangle_color=ManimColor('#000000'), element_to_mobject=<class 'manim.mobject.text.text_mobject.Paragraph'>, element_to_mobject_config={}, arrange_in_grid_config={}, line_config={}, **kwargs)[source]
基类:
VGroup一个在屏幕上显示表格的 Mobject。
- 参数:
table (Iterable[Iterable[float | str | VMobject]]) – 一个二维数组或列表的列表。表格内容必须是
element_to_mobject中可调用函数设定的有效输入。row_labels (Iterable[VMobject] | None) – 表示每行标签的
VMobject列表。col_labels (Iterable[VMobject] | None) – 表示每列标签的
VMobject列表。top_left_entry (VMobject | None) – 表格的左上角条目,仅当给定行和列标签时才能指定。
v_buff (float) – 传递给
arrange_in_grid()的垂直缓冲,默认为 0.8。h_buff (float) – 传递给
arrange_in_grid()的水平缓冲,默认为 1.3。include_outer_lines (bool) – 如果表格应包含外线,则为
True,默认为 False。add_background_rectangles_to_entries (bool) – 如果应为条目添加背景矩形,则为
True,默认为False。entries_background_color (ParsableManimColor) – 如果
add_background_rectangles_to_entries为True,则为条目的背景颜色。include_background_rectangle (bool) – 如果表格应具有背景矩形,则为
True,默认为False。background_rectangle_color (ParsableManimColor) – 如果
include_background_rectangle为True,则为表格的背景颜色。element_to_mobject (Callable[[float | str | VMobject], VMobject]) – 应用于表格条目的
Mobject类。默认为Paragraph。有关常见选择,请参阅text_mobject/tex_mobject。element_to_mobject_config (dict) – 传递给
element_to_mobject的自定义配置,默认为 {}。arrange_in_grid_config (dict) – 传递给
arrange_in_grid()的字典,用于自定义表格的排列方式。line_config (dict) – 传递给
Line的字典,用于自定义表格的线条。kwargs – 要传递给
VGroup的额外参数。
示例
示例: TableExamples 
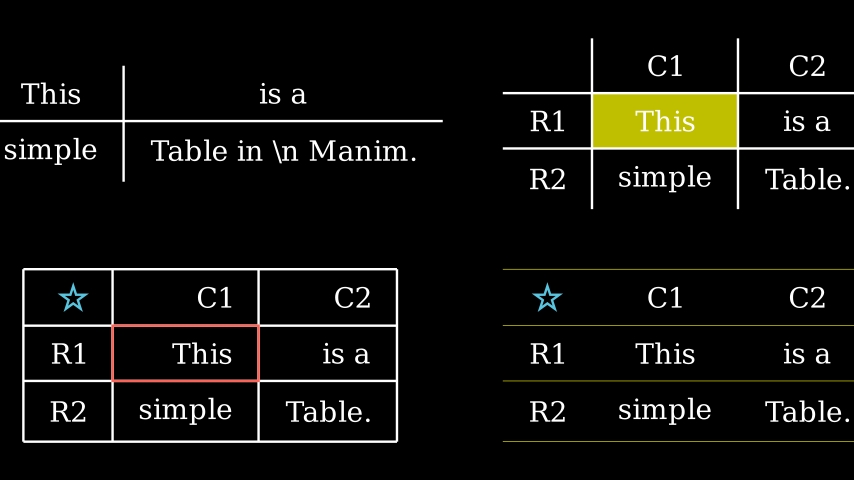
from manim import *

class TableExamples(Scene):
    def construct(self):
        t0 = Table(
            [["This", "is a"],
            ["simple", "Table in \\n Manim."]])
        t1 = Table(
            [["This", "is a"],
            ["simple", "Table."]],
            row_labels=[Text("R1"), Text("R2")],
            col_labels=[Text("C1"), Text("C2")])
        t1.add_highlighted_cell((2,2), color=YELLOW)
        t2 = Table(
            [["This", "is a"],
            ["simple", "Table."]],
            row_labels=[Text("R1"), Text("R2")],
            col_labels=[Text("C1"), Text("C2")],
            top_left_entry=Star().scale(0.3),
            include_outer_lines=True,
            arrange_in_grid_config={"cell_alignment": RIGHT})
        t2.add(t2.get_cell((2,2), color=RED))
        t3 = Table(
            [["This", "is a"],
            ["simple", "Table."]],
            row_labels=[Text("R1"), Text("R2")],
            col_labels=[Text("C1"), Text("C2")],
            top_left_entry=Star().scale(0.3),
            include_outer_lines=True,
            line_config={"stroke_width": 1, "color": YELLOW})
        t3.remove(*t3.get_vertical_lines())
        g = Group(
            t0,t1,t2,t3
        ).scale(0.7).arrange_in_grid(buff=1)
        self.add(g)
示例: BackgroundRectanglesExample 
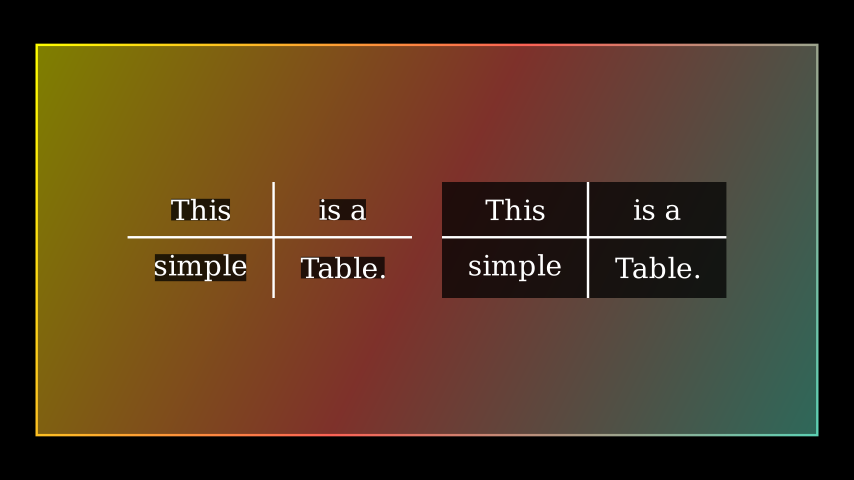
from manim import *

class BackgroundRectanglesExample(Scene):
    def construct(self):
        background = Rectangle(height=6.5, width=13)
        background.set_fill(opacity=.5)
        background.set_color([TEAL, RED, YELLOW])
        self.add(background)
        t0 = Table(
            [["This", "is a"],
            ["simple", "Table."]],
            add_background_rectangles_to_entries=True)
        t1 = Table(
            [["This", "is a"],
            ["simple", "Table."]],
            include_background_rectangle=True)
        g = Group(t0, t1).scale(0.7).arrange(buff=0.5)
        self.add(g)
方法
为表格的每个条目添加一个黑色
BackgroundRectangle。通过添加
BackgroundRectangle来突出显示表格上特定位置的一个单元格。表格的自定义创建类型函数。
返回一个特定的单元格作为矩形
Polygon,不包括条目。返回表格的列标签。
返回表格的各个条目(包括标签),如果参数
pos已设置,则返回一个特定条目。返回表格的各个条目(不包括标签),如果参数
pos已设置,则返回一个特定条目。返回给定位置单元格的
BackgroundRectangle。返回表格的水平线。
返回表格的标签。
返回表格的行标签。
返回表格的垂直线。
按比例因子缩放大小。
为表格的每列设置单独的颜色。
为表格的每行设置单独的颜色。
属性
animate (动画)用于动画化
self的任何方法的应用。animation_overrides (动画覆盖)颜色depth (深度)mobject 的深度。
fill_color (填充颜色)如果存在多种颜色(用于渐变),则返回第一种颜色
height (高度)mobject 的高度。
n_points_per_curve (每条曲线的点数)sheen_factor (光泽因子)stroke_color (描边颜色)width (宽度)mobject 的宽度。
- _original__init__(table, row_labels=None, col_labels=None, top_left_entry=None, v_buff=0.8, h_buff=1.3, include_outer_lines=False, add_background_rectangles_to_entries=False, entries_background_color=ManimColor('#000000'), include_background_rectangle=False, background_rectangle_color=ManimColor('#000000'), element_to_mobject=<class 'manim.mobject.text.text_mobject.Paragraph'>, element_to_mobject_config={}, arrange_in_grid_config={}, line_config={}, **kwargs)
初始化自身。有关准确签名,请参阅 help(type(self))。
- 参数:
table (Iterable[Iterable[float | str | VMobject]])
row_labels (Iterable[VMobject] | None)
col_labels (Iterable[VMobject] | None)
top_left_entry (VMobject | None)
v_buff (float)
h_buff (float)
include_outer_lines (bool)
add_background_rectangles_to_entries (bool)
entries_background_color (ParsableManimColor)
include_background_rectangle (bool)
background_rectangle_color (ParsableManimColor)
element_to_mobject (Callable[[float | str | VMobject], VMobject])
element_to_mobject_config (dict)
arrange_in_grid_config (dict)
line_config (dict)
- add_background_to_entries(color=ManimColor('#000000'))[source]
为表格的每个条目添加一个黑色
BackgroundRectangle。- 参数:
color (ParsableManimColor)
- 返回类型:
- add_highlighted_cell(pos=(1, 1), color=ManimColor('#FFFF00'), **kwargs)[source]
通过添加
BackgroundRectangle来突出显示表格上特定位置的一个单元格。- 参数:
pos (Sequence[int]) – 表格上特定条目的位置。
(1,1)是表格的左上角条目。color (ParsableManimColor) – 用于突出显示单元格的颜色。
kwargs – 要传递给
BackgroundRectangle的额外参数。
- 返回类型:
示例
示例: AddHighlightedCellExample 
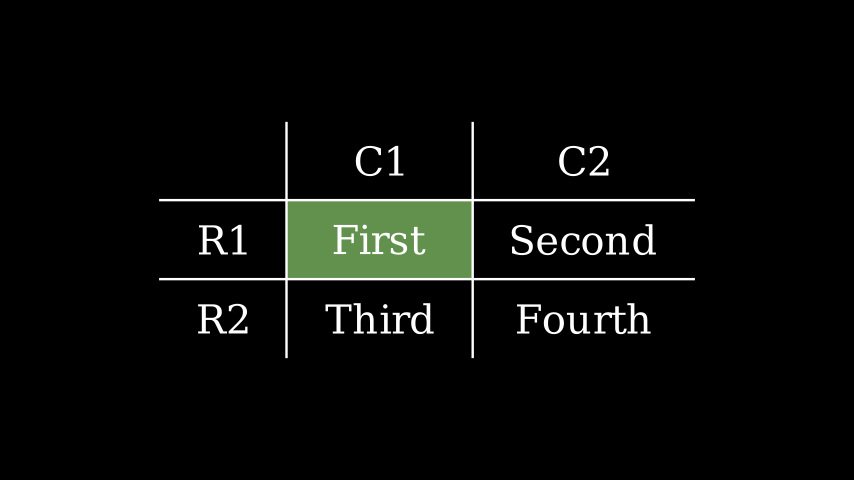
from manim import *

class AddHighlightedCellExample(Scene):
    def construct(self):
        table = Table(
            [["First", "Second"],
            ["Third","Fourth"]],
            row_labels=[Text("R1"), Text("R2")],
            col_labels=[Text("C1"), Text("C2")])
        table.add_highlighted_cell((2,2), color=GREEN)
        self.add(table)
- create(lag_ratio=1, line_animation=<class 'manim.animation.creation.Create'>, label_animation=<class 'manim.animation.creation.Write'>, element_animation=<class 'manim.animation.creation.Create'>, entry_animation=<class 'manim.animation.fading.FadeIn'>, **kwargs)[source]
表格的自定义创建类型函数。
- 参数:
lag_ratio (float) – 动画的滞后比例。
line_animation (Callable[[VMobject | VGroup], Animation]) – 表格线条的动画样式,参见
creation获取示例。label_animation (Callable[[VMobject | VGroup], Animation]) – 表格标签的动画样式,参见
creation获取示例。element_animation (Callable[[VMobject | VGroup], Animation]) – 表格元素的动画样式,参见
creation获取示例。entry_animation (Callable[[VMobject | VGroup], Animation]) – 表格背景的进入动画,参见
creation获取示例。kwargs – 传递给创建动画的更多参数。
- 返回:
包含线条和元素创建的 AnimationGroup。
- 返回类型:
示例
示例: CreateTableExample 
from manim import *

class CreateTableExample(Scene):
    def construct(self):
        table = Table(
            [["First", "Second"],
            ["Third","Fourth"]],
            row_labels=[Text("R1"), Text("R2")],
            col_labels=[Text("C1"), Text("C2")],
            include_outer_lines=True)
        self.play(table.create())
        self.wait()
- get_cell(pos=(1, 1), **kwargs)[source]
返回一个特定的单元格作为矩形
Polygon,不包括条目。- 参数:
pos (Sequence[int]) – 表格上特定条目的位置。
(1,1)是表格的左上角条目。kwargs – 要传递给
Polygon的额外参数。
- 返回:
模拟表格中某个特定单元格的多边形。
- 返回类型:
示例
示例: GetCellExample 
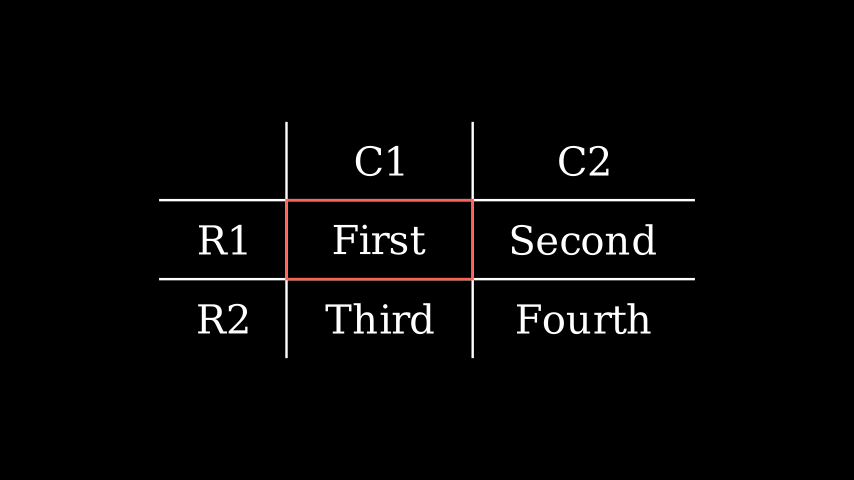
from manim import *

class GetCellExample(Scene):
    def construct(self):
        table = Table(
            [["First", "Second"],
            ["Third","Fourth"]],
            row_labels=[Text("R1"), Text("R2")],
            col_labels=[Text("C1"), Text("C2")])
        cell = table.get_cell((2,2), color=RED)
        self.add(table, cell)
- get_col_labels()[source]
返回表格的列标签。
- 返回:
包含表格列标签的 VGroup。
- 返回类型:
示例
示例: GetColLabelsExample 
from manim import *

class GetColLabelsExample(Scene):
    def construct(self):
        table = Table(
            [["First", "Second"],
            ["Third","Fourth"]],
            row_labels=[Text("R1"), Text("R2")],
            col_labels=[Text("C1"), Text("C2")])
        lab = table.get_col_labels()
        for item in lab:
            item.set_color(random_bright_color())
        self.add(table)
- get_columns()[source]
-
示例
示例: GetColumnsExample 
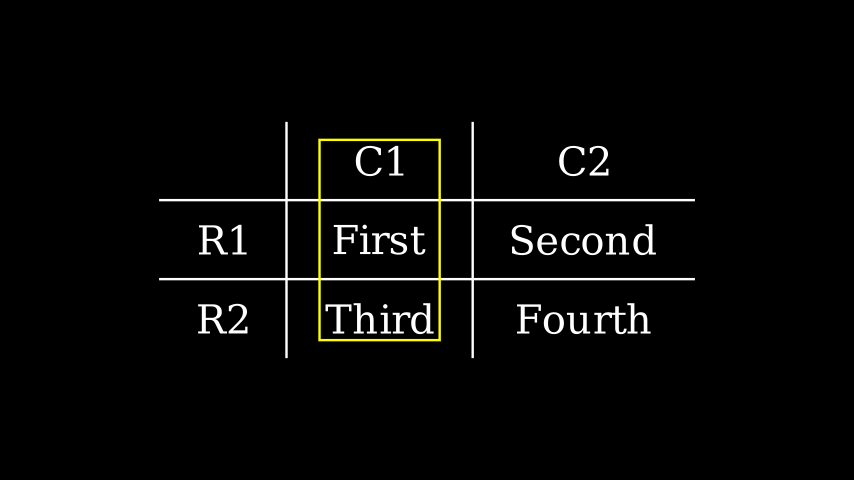
from manim import *

class GetColumnsExample(Scene):
    def construct(self):
        table = Table(
            [["First", "Second"],
            ["Third","Fourth"]],
            row_labels=[Text("R1"), Text("R2")],
            col_labels=[Text("C1"), Text("C2")])
        table.add(SurroundingRectangle(table.get_columns()[1]))
        self.add(table)
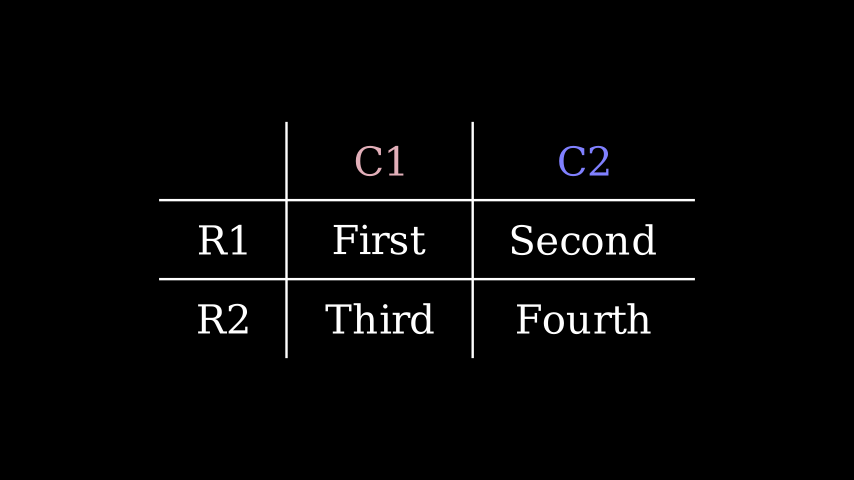
- get_entries(pos=None)[source]
返回表格的各个条目(包括标签),如果参数
pos已设置,则返回一个特定条目。- 参数:
pos (Sequence[int] | None) – 表格上特定条目的位置。
(1,1)是表格的左上角条目。- 返回:
- 返回类型:
示例
示例: GetEntriesExample 
from manim import *

class GetEntriesExample(Scene):
    def construct(self):
        table = Table(
            [["First", "Second"],
            ["Third","Fourth"]],
            row_labels=[Text("R1"), Text("R2")],
            col_labels=[Text("C1"), Text("C2")])
        ent = table.get_entries()
        for item in ent:
            item.set_color(random_bright_color())
        table.get_entries((2,2)).rotate(PI)
        self.add(table)
- get_entries_without_labels(pos=None)[source]
返回表格的各个条目(不包括标签),如果参数
pos已设置,则返回一个特定条目。- 参数:
pos (Sequence[int] | None) – 表格上特定条目的位置。
(1,1)是表格的左上角条目(不包括标签)。- 返回:
- 返回类型:
示例
示例: GetEntriesWithoutLabelsExample 
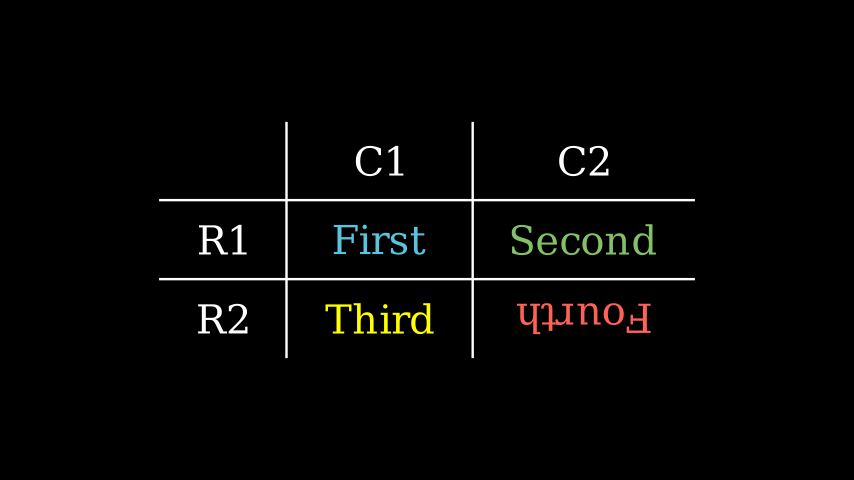
from manim import *

class GetEntriesWithoutLabelsExample(Scene):
    def construct(self):
        table = Table(
            [["First", "Second"],
            ["Third","Fourth"]],
            row_labels=[Text("R1"), Text("R2")],
            col_labels=[Text("C1"), Text("C2")])
        ent = table.get_entries_without_labels()
        colors = [BLUE, GREEN, YELLOW, RED]
        for k in range(len(colors)):
            ent[k].set_color(colors[k])
        table.get_entries_without_labels((2,2)).rotate(PI)
        self.add(table)
- get_highlighted_cell(pos=(1, 1), color=ManimColor('#FFFF00'), **kwargs)[source]
返回给定位置单元格的
BackgroundRectangle。- 参数:
pos (Sequence[int]) – 表格上特定条目的位置。
(1,1)是表格的左上角条目。color (ParsableManimColor) – 用于突出显示单元格的颜色。
kwargs – 要传递给
BackgroundRectangle的额外参数。
- 返回类型:
示例
示例: GetHighlightedCellExample 

from manim import *

class GetHighlightedCellExample(Scene):
    def construct(self):
        table = Table(
            [["First", "Second"],
            ["Third","Fourth"]],
            row_labels=[Text("R1"), Text("R2")],
            col_labels=[Text("C1"), Text("C2")])
        highlight = table.get_highlighted_cell((2,2), color=GREEN)
        table.add_to_back(highlight)
        self.add(table)
- get_horizontal_lines()[source]
返回表格的水平线。
示例
示例: GetHorizontalLinesExample 
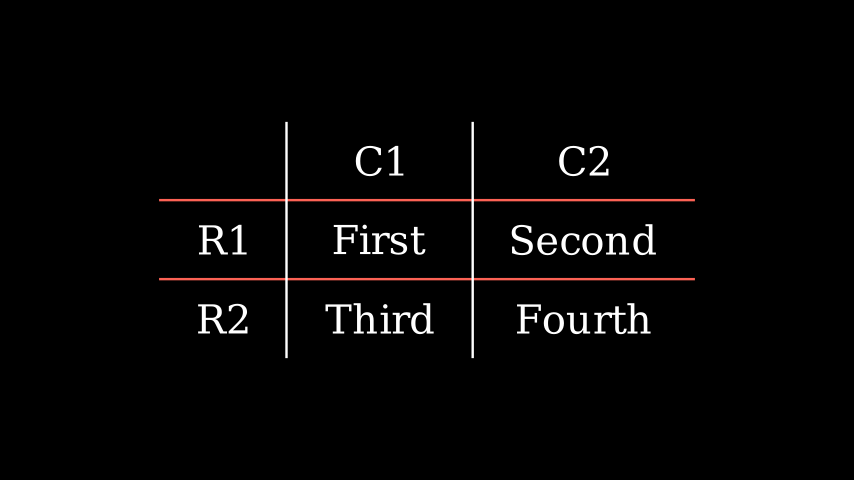
from manim import *

class GetHorizontalLinesExample(Scene):
    def construct(self):
        table = Table(
            [["First", "Second"],
            ["Third","Fourth"]],
            row_labels=[Text("R1"), Text("R2")],
            col_labels=[Text("C1"), Text("C2")])
        table.get_horizontal_lines().set_color(RED)
        self.add(table)
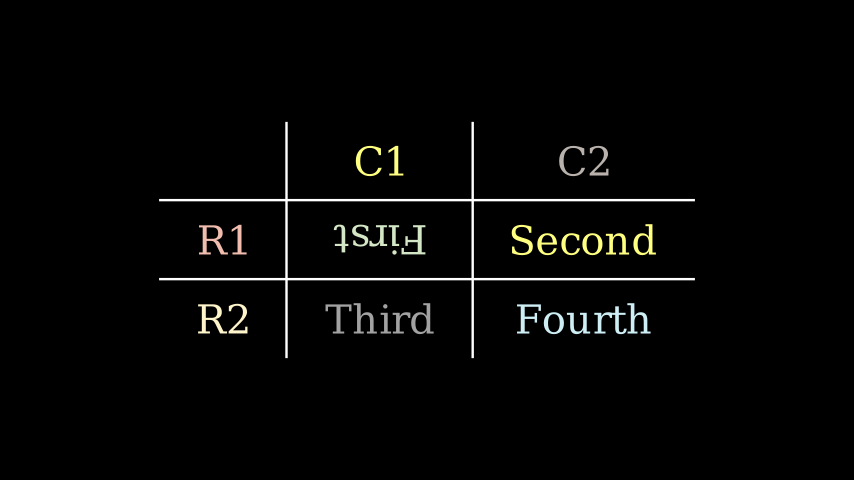
- get_labels()[source]
返回表格的标签。
示例
示例: GetLabelsExample 
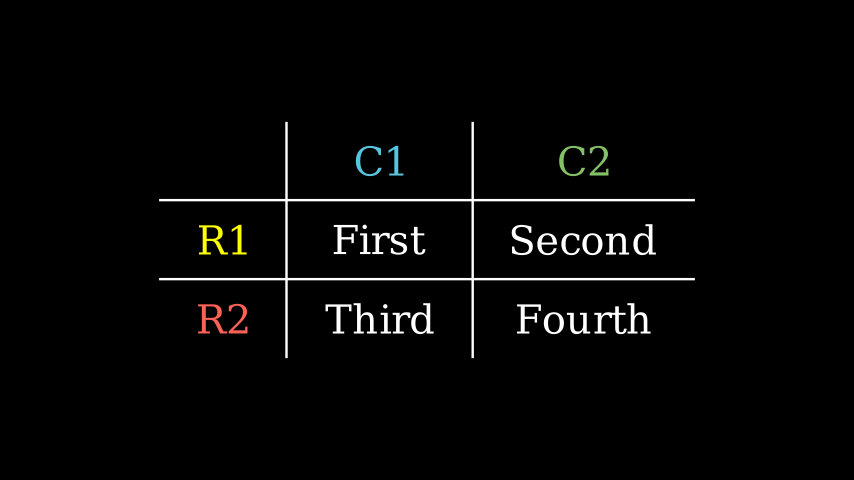
from manim import *

class GetLabelsExample(Scene):
    def construct(self):
        table = Table(
            [["First", "Second"],
            ["Third","Fourth"]],
            row_labels=[Text("R1"), Text("R2")],
            col_labels=[Text("C1"), Text("C2")])
        lab = table.get_labels()
        colors = [BLUE, GREEN, YELLOW, RED]
        for k in range(len(colors)):
            lab[k].set_color(colors[k])
        self.add(table)
- get_row_labels()[source]
返回表格的行标签。
示例
示例: GetRowLabelsExample 
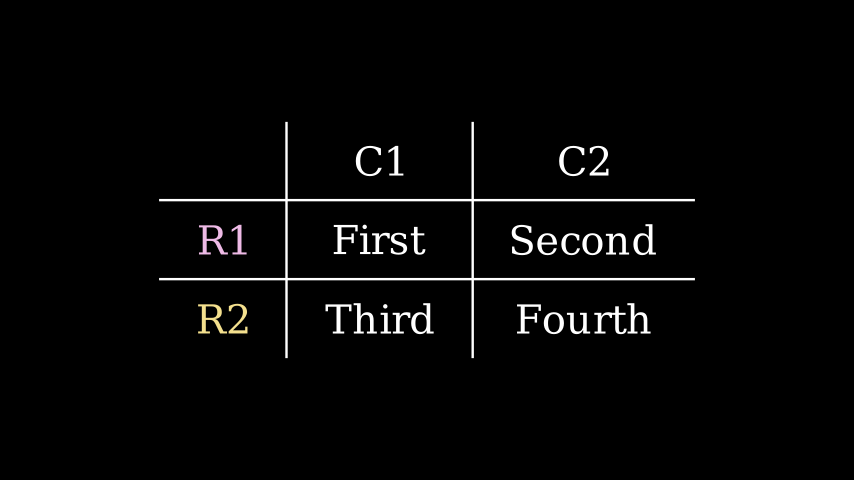
from manim import *

class GetRowLabelsExample(Scene):
    def construct(self):
        table = Table(
            [["First", "Second"],
            ["Third","Fourth"]],
            row_labels=[Text("R1"), Text("R2")],
            col_labels=[Text("C1"), Text("C2")])
        lab = table.get_row_labels()
        for item in lab:
            item.set_color(random_bright_color())
        self.add(table)
- get_rows()[source]
-
示例
示例: GetRowsExample 
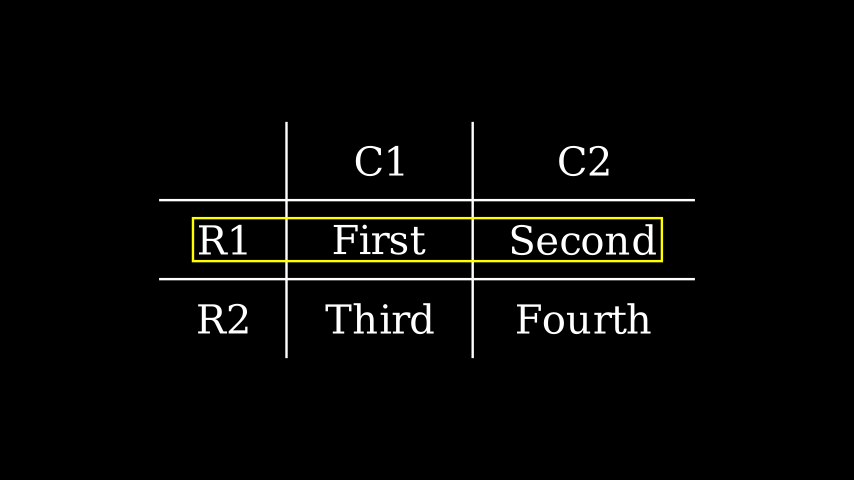
from manim import *

class GetRowsExample(Scene):
    def construct(self):
        table = Table(
            [["First", "Second"],
            ["Third","Fourth"]],
            row_labels=[Text("R1"), Text("R2")],
            col_labels=[Text("C1"), Text("C2")])
        table.add(SurroundingRectangle(table.get_rows()[1]))
        self.add(table)
- get_vertical_lines()[source]
返回表格的垂直线。
示例
示例: GetVerticalLinesExample 
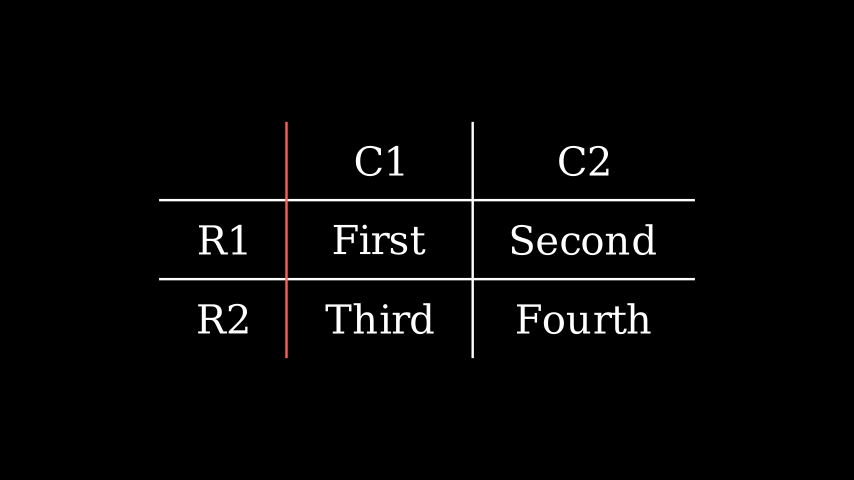
from manim import *

class GetVerticalLinesExample(Scene):
    def construct(self):
        table = Table(
            [["First", "Second"],
            ["Third","Fourth"]],
            row_labels=[Text("R1"), Text("R2")],
            col_labels=[Text("C1"), Text("C2")])
        table.get_vertical_lines()[0].set_color(RED)
        self.add(table)
- scale(scale_factor, **kwargs)[source]
按比例因子缩放大小。
默认行为是围绕 vmobject 的中心进行缩放。
- 参数:
scale_factor (float) – 缩放因子 \(\alpha\)。如果 \(0 < |\alpha| < 1\),mobject 将缩小;如果 \(|\alpha| > 1\),它将增大。此外,如果 \(\alpha < 0\),mobject 也会翻转。
scale_stroke – 布尔值,确定对象缩放时其轮廓是否也缩放。如果启用此选项,且轮廓为 2px 的对象按 0.5 因子缩放,则其轮廓将变为 1px。
kwargs – 传递给
scale()的额外关键字参数。
- 返回:
自身- 返回类型:
VMobject
示例
示例: MobjectScaleExample 
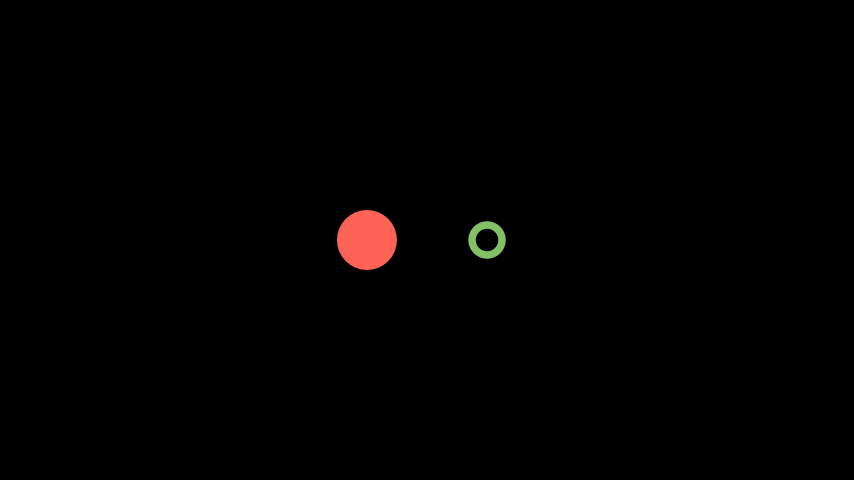
from manim import *

class MobjectScaleExample(Scene):
    def construct(self):
        c1 = Circle(1, RED).set_x(-1)
        c2 = Circle(1, GREEN).set_x(1)

        vg = VGroup(c1, c2)
        vg.set_stroke(width=50)
        self.add(vg)

        self.play(
            c1.animate.scale(.25),
            c2.animate.scale(.25,
                scale_stroke=True)
        )
另请参阅
move_to()
- set_column_colors(*colors)[source]
为表格的每列设置单独的颜色。
- 参数:
colors (Iterable[ParsableManimColor]) – 一个颜色可迭代对象;每个颜色对应一列。
- 返回类型:
示例
示例: SetColumnColorsExample 
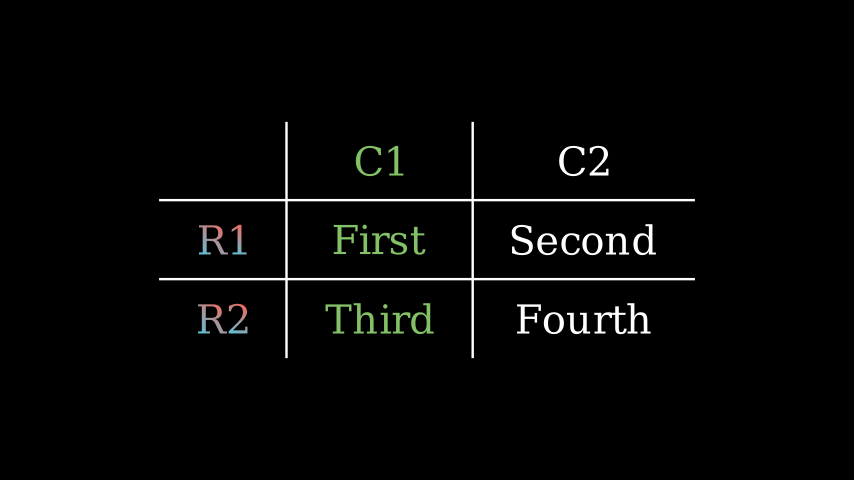
from manim import *

class SetColumnColorsExample(Scene):
    def construct(self):
        table = Table(
            [["First", "Second"],
            ["Third","Fourth"]],
            row_labels=[Text("R1"), Text("R2")],
            col_labels=[Text("C1"), Text("C2")]
        ).set_column_colors([RED,BLUE], GREEN)
        self.add(table)
- set_row_colors(*colors)[source]
为表格的每行设置单独的颜色。
- 参数:
colors (Iterable[ParsableManimColor]) – 一个颜色可迭代对象;每个颜色对应一行。
- 返回类型:
示例
示例: SetRowColorsExample 
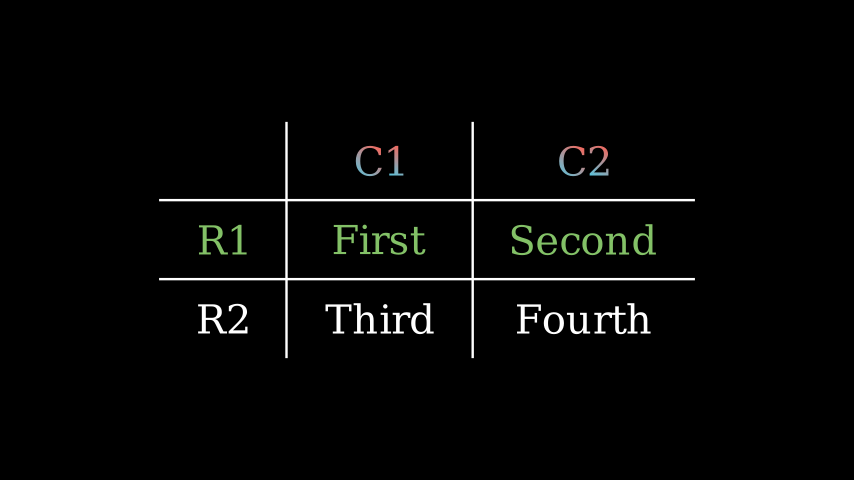
from manim import *

class SetRowColorsExample(Scene):
    def construct(self):
        table = Table(
            [["First", "Second"],
            ["Third","Fourth"]],
            row_labels=[Text("R1"), Text("R2")],
            col_labels=[Text("C1"), Text("C2")]
        ).set_row_colors([RED,BLUE], GREEN)
        self.add(table)