图
限定名称: manim.mobject.graph.Graph
- class Graph(vertices, edges, labels=False, label_fill_color=ManimColor('#000000'), layout='spring', layout_scale=2, layout_config=None, vertex_type=<class 'manim.mobject.geometry.arc.Dot'>, vertex_config=None, vertex_mobjects=None, edge_type=<class 'manim.mobject.geometry.line.Line'>, partitions=None, root_vertex=None, edge_config=None)[source]
基类:
GenericGraph一个无向图(顶点通过边连接)。
该图附带一个更新器,当顶点移动时,更新器会使边保持与顶点连接。有关带方向边的版本,请参见
DiGraph。另请参阅
- 参数:
vertices (序列[可哈希]) – 顶点列表。必须是可哈希元素。
edges (序列[元组[可哈希, 可哈希]]) – 边列表,以元组
(u, v)形式指定,其中u和v都是顶点。顶点顺序无关紧要。labels (布尔值 | 字典) – 控制顶点是否被标记。如果为
False(默认值),则顶点不被标记;如果为True,则通过MathTex使用其名称(如vertices中指定)进行标记。另外,可以通过传递一个字典来指定自定义标签,该字典的键是顶点,值是相应的顶点标签(例如通过Text或Tex渲染)。label_fill_color (字符串) – 设置当
labels设置为True时生成的默认标签的填充颜色。对于labels的其他值,此设置无效。layout (布局名称 | 字典[可哈希, 三维点坐标类型] | 布局函数) – 可以是用于使用
networkx自动定位顶点的预设布局之一,如"spring"(默认)、"circular"、"kamada_kawai"、"planar"、"random"、"shell"、"spectral"、"spiral"、"tree"和"partite"(有关更多详细信息,请参阅其文档),也可以是一个字典,其中为每个顶点(键)指定一个坐标(值)用于手动定位。layout_config (字典 | 无) – 仅适用于自动生成的布局。一个字典,其条目作为关键字参数传递给通过
networkx的layout指定的自动布局算法。tree布局还接受一个特殊的参数vertex_spacing,作为关键字参数在layout_config字典中传递。将元组(space_x, space_y)作为此参数传递会覆盖layout_scale的值,并确保顶点的排列方式使同一层中兄弟节点的中心水平距离至少为space_x单位,相邻层垂直距离为space_y单位。layout_scale (浮点数 | 元组[浮点数, 浮点数, 浮点数]) – 自动生成布局的比例:顶点将排列在坐标位于
[-scale, scale]区间内。某些布局接受元组(scale_x, scale_y),使第一个坐标位于[-scale_x, scale_x]区间,第二个坐标位于[-scale_y, scale_y]区间。默认值:2。vertex_type (类型[Mobject]) – 用于在场景中显示顶点的mobject类。
vertex_config (字典 | 无) – 一个字典,包含要传递给通过
vertex_type指定的类的关键字参数,或者一个字典,其键是顶点,其值是包含与相应顶点相关的mobject的关键字参数的字典。vertex_mobjects (字典 | 无) – 一个字典,其键是顶点,值是作为顶点使用的 mobject。在此处传递顶点会覆盖顶点所有其他配置选项。
edge_type (类型[Mobject]) – 用于在场景中显示边的mobject类。
edge_config (字典 | 无) – 一个字典,包含要传递给通过
edge_type指定的类的关键字参数,或者一个字典,其键是边,其值是包含与相应边相关的mobject的关键字参数的字典。partitions (序列[序列[可哈希]] | 无)
root_vertex (可哈希 | 无)
示例
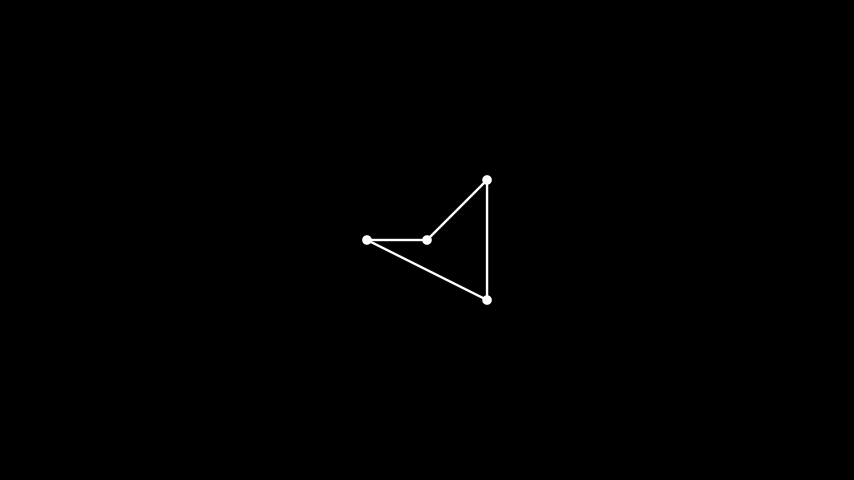
首先,我们创建一个小图并演示当顶点移动时,边会随之移动。
示例: 移动顶点 
from manim import *

class MovingVertices(Scene):
    def construct(self):
        vertices = [1, 2, 3, 4]
        edges = [(1, 2), (2, 3), (3, 4), (1, 3), (1, 4)]
        g = Graph(vertices, edges)
        self.play(Create(g))
        self.wait()
        self.play(g[1].animate.move_to([1, 1, 0]),
                  g[2].animate.move_to([-1, 1, 0]),
                  g[3].animate.move_to([1, -1, 0]),
                  g[4].animate.move_to([-1, -1, 0]))
        self.wait()
有几种自动定位算法可供选择
示例: 图自动定位 

from manim import *

class GraphAutoPosition(Scene):
    def construct(self):
        vertices = [1, 2, 3, 4, 5, 6, 7, 8]
        edges = [(1, 7), (1, 8), (2, 3), (2, 4), (2, 5),
                 (2, 8), (3, 4), (6, 1), (6, 2),
                 (6, 3), (7, 2), (7, 4)]
        autolayouts = ["spring", "circular", "kamada_kawai",
                       "planar", "random", "shell",
                       "spectral", "spiral"]
        graphs = [Graph(vertices, edges, layout=lt).scale(0.5)
                  for lt in autolayouts]
        r1 = VGroup(*graphs[:3]).arrange()
        r2 = VGroup(*graphs[3:6]).arrange()
        r3 = VGroup(*graphs[6:]).arrange()
        self.add(VGroup(r1, r2, r3).arrange(direction=DOWN))
顶点也可以手动定位
示例: 图手动定位 
from manim import *

class GraphManualPosition(Scene):
    def construct(self):
        vertices = [1, 2, 3, 4]
        edges = [(1, 2), (2, 3), (3, 4), (4, 1)]
        lt = {1: [0, 0, 0], 2: [1, 1, 0], 3: [1, -1, 0], 4: [-1, 0, 0]}
        G = Graph(vertices, edges, layout=lt)
        self.add(G)
class GraphManualPosition(Scene):
    def construct(self):
        vertices = [1, 2, 3, 4]
        edges = [(1, 2), (2, 3), (3, 4), (4, 1)]
        lt = {1: [0, 0, 0], 2: [1, 1, 0], 3: [1, -1, 0], 4: [-1, 0, 0]}
        G = Graph(vertices, edges, layout=lt)
        self.add(G)
图中的顶点可以被标记,并且顶点和边的配置可以默认修改,也可以针对特定的顶点和边进行修改。
注意
在
edge_config中,边可以双向传递:如果(u, v)是图中的一条边,则(u, v)和(v, u)都可以用作字典中的键。示例: 带标签的修改图 
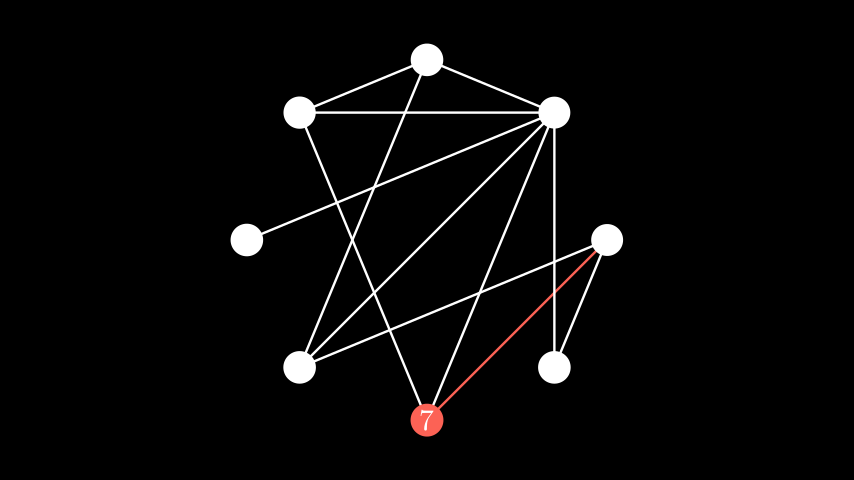
from manim import *

class LabeledModifiedGraph(Scene):
    def construct(self):
        vertices = [1, 2, 3, 4, 5, 6, 7, 8]
        edges = [(1, 7), (1, 8), (2, 3), (2, 4), (2, 5),
                 (2, 8), (3, 4), (6, 1), (6, 2),
                 (6, 3), (7, 2), (7, 4)]
        g = Graph(vertices, edges, layout="circular", layout_scale=3,
                  labels=True, vertex_config={7: {"fill_color": RED}},
                  edge_config={(1, 7): {"stroke_color": RED},
                               (2, 7): {"stroke_color": RED},
                               (4, 7): {"stroke_color": RED}})
        self.add(g)
您还可以通过指定每一侧的顶点列表并选择分区布局,将一个分部图按列布局。
注意
图中未在任何分区中列出的所有顶点都会被收集到自己的分区中,并在最右边的列中渲染。
示例: 分部图 

from manim import *

import networkx as nx

class PartiteGraph(Scene):
    def construct(self):
        G = nx.Graph()
        G.add_nodes_from([0, 1, 2, 3])
        G.add_edges_from([(0, 2), (0,3), (1, 2)])
        graph = Graph(list(G.nodes), list(G.edges), layout="partite", partitions=[[0, 1]])
        self.play(Create(graph))
通过使用分部布局并为每个层定义分区,可以方便地表示线性人工神经网络。
示例: 线性神经网络 

from manim import *

class LinearNN(Scene):
    def construct(self):
        edges = []
        partitions = []
        c = 0
        layers = [2, 3, 3, 2]  # the number of neurons in each layer

        for i in layers:
            partitions.append(list(range(c + 1, c + i + 1)))
            c += i
        for i, v in enumerate(layers[1:]):
                last = sum(layers[:i+1])
                for j in range(v):
                    for k in range(last - layers[i], last):
                        edges.append((k + 1, j + last + 1))

        vertices = np.arange(1, sum(layers) + 1)

        graph = Graph(
            vertices,
            edges,
            layout='partite',
            partitions=partitions,
            layout_scale=3,
            vertex_config={'radius': 0.20},
        )
        self.add(graph)
自定义树布局可用于按与根顶点的距离显示图。您必须传递树的根顶点。
示例: 树 
from manim import *

import networkx as nx

class Tree(Scene):
    def construct(self):
        G = nx.Graph()

        G.add_node("ROOT")

        for i in range(5):
            G.add_node("Child_%i" % i)
            G.add_node("Grandchild_%i" % i)
            G.add_node("Greatgrandchild_%i" % i)

            G.add_edge("ROOT", "Child_%i" % i)
            G.add_edge("Child_%i" % i, "Grandchild_%i" % i)
            G.add_edge("Grandchild_%i" % i, "Greatgrandchild_%i" % i)

        self.play(Create(
            Graph(list(G.nodes), list(G.edges), layout="tree", root_vertex="ROOT")))
以下代码示例演示了特定于
"tree"布局的vertex_spacing布局参数的用法。如上所述,设置vertex_spacing会覆盖layout_scale的指定值,因此更难控制 mobject 的大小。但是,我们可以通过使用MovingCameraScene来调整捕获的帧并缩小。class LargeTreeGeneration(MovingCameraScene): DEPTH = 4 CHILDREN_PER_VERTEX = 3 LAYOUT_CONFIG = {"vertex_spacing": (0.5, 1)} VERTEX_CONF = {"radius": 0.25, "color": BLUE_B, "fill_opacity": 1} def expand_vertex(self, g, vertex_id: str, depth: int): new_vertices = [ f"{vertex_id}/{i}" for i in range(self.CHILDREN_PER_VERTEX) ] new_edges = [(vertex_id, child_id) for child_id in new_vertices] g.add_edges( *new_edges, vertex_config=self.VERTEX_CONF, positions={ k: g.vertices[vertex_id].get_center() + 0.1 * DOWN for k in new_vertices }, ) if depth < self.DEPTH: for child_id in new_vertices: self.expand_vertex(g, child_id, depth + 1) return g def construct(self): g = Graph(["ROOT"], [], vertex_config=self.VERTEX_CONF) g = self.expand_vertex(g, "ROOT", 1) self.add(g) self.play( g.animate.change_layout( "tree", root_vertex="ROOT", layout_config=self.LAYOUT_CONFIG, ) ) self.play(self.camera.auto_zoom(g, margin=1), run_time=0.5)
方法
更新边属性
animate (动画)用于动画化
self的任何方法的应用。animation_overrides (动画覆盖)颜色depth (深度)mobject 的深度。
fill_color (填充颜色)如果存在多种颜色(用于渐变),则返回第一种颜色
height (高度)mobject 的高度。
n_points_per_curve (每条曲线的点数)sheen_factor (光泽因子)stroke_color (描边颜色)width (宽度)mobject 的宽度。
- _原始__init__(vertices, edges, labels=False, label_fill_color=ManimColor('#000000'), layout='spring', layout_scale=2, layout_config=None, vertex_type=<class 'manim.mobject.geometry.arc.Dot'>, vertex_config=None, vertex_mobjects=None, edge_type=<class 'manim.mobject.geometry.line.Line'>, partitions=None, root_vertex=None, edge_config=None)
初始化自身。有关准确签名,请参阅 help(type(self))。
- 参数:
vertices (序列[可哈希])
edges (序列[元组[可哈希, 可哈希]])
labels (布尔值 | 字典)
label_fill_color (字符串)
layout (字面值['circular', 'kamada_kawai', 'partite', 'planar', 'random', 'shell', 'spectral', 'spiral', 'spring', 'tree'] | 字典[~collections.abc.Hashable, ~manim.typing.Point3DLike] | ~manim.mobject.graph.LayoutFunction)
layout_scale (浮点数 | 元组[浮点数, 浮点数, 浮点数])
layout_config (字典 | 无)
vertex_type (类型[Mobject])
vertex_config (字典 | 无)
vertex_mobjects (字典 | 无)
edge_type (类型[Mobject])
partitions (序列[序列[可哈希]] | 无)
root_vertex (可哈希 | 无)
edge_config (字典 | 无)
- 返回类型:
无