坐标轴
限定名称: manim.mobject.graphing.coordinate\_systems.Axes
- class Axes(x_range=None, y_range=None, x_length=12, y_length=6, axis_config=None, x_axis_config=None, y_axis_config=None, tips=True, **kwargs)[source]
基类:
VGroup,CoordinateSystem创建一组坐标轴。
- 参数:
x_range (Sequence[float] | None) – x轴的
(x_min, x_max, x_step)值。y_range (Sequence[float] | None) – y轴的
(y_min, y_max, y_step)值。x_length (float | None) – x轴的长度。
y_length (float | None) – y轴的长度。
axis_config (dict | None) – 传递给
NumberLine的参数,用于影响两个坐标轴。x_axis_config (dict | None) – 传递给
NumberLine的参数,用于影响x轴。y_axis_config (dict | None) – 传递给
NumberLine的参数,用于影响y轴。tips (bool) – 是否在两个坐标轴上包含尖端。
kwargs (Any) – 传递给
CoordinateSystem和VGroup的额外参数。
示例
示例: LogScalingExample 
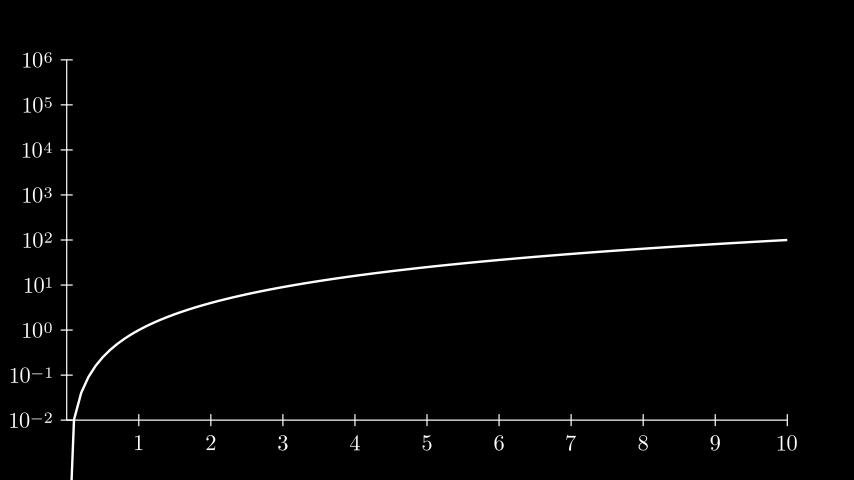
from manim import *

class LogScalingExample(Scene):
    def construct(self):
        ax = Axes(
            x_range=[0, 10, 1],
            y_range=[-2, 6, 1],
            tips=False,
            axis_config={"include_numbers": True},
            y_axis_config={"scaling": LogBase(custom_labels=True)},
        )

        # x_min must be > 0 because log is undefined at 0.
        graph = ax.plot(lambda x: x ** 2, x_range=[0.001, 10], use_smoothing=False)
        self.add(ax, graph)
样式参数可以传递给表示坐标轴的底层
NumberLinemobject。示例: AxesWithDifferentTips 
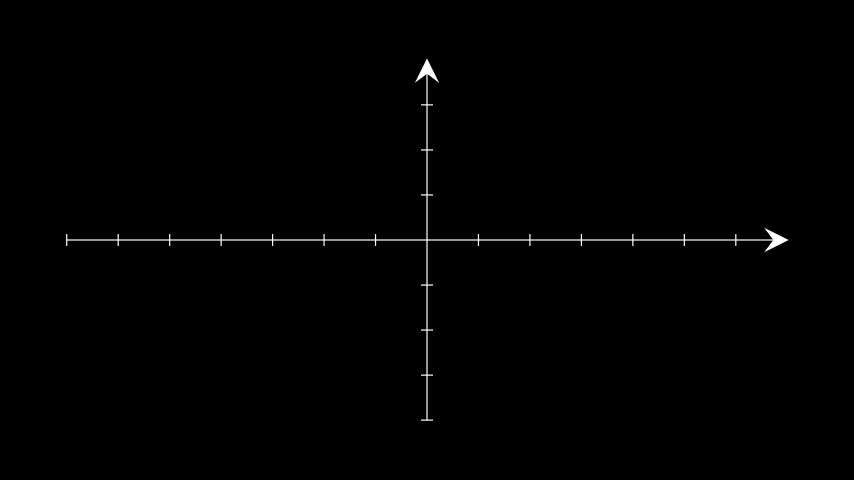
from manim import *

class AxesWithDifferentTips(Scene):
    def construct(self):
        ax = Axes(axis_config={'tip_shape': StealthTip})
        self.add(ax)
class AxesWithDifferentTips(Scene):
    def construct(self):
        ax = Axes(axis_config={'tip_shape': StealthTip})
        self.add(ax)
方法
接受坐标轴上的坐标,并返回场景中的一个点。
获取坐标轴。
定义图表的x轴和y轴的标签。
绘制线形图。
接受场景中的一个点,并返回其在坐标轴上的坐标。
属性
animate (动画)用于动画化
self的任何方法的应用。animation_overrides (动画覆盖)颜色depth (深度)mobject 的深度。
fill_color (填充颜色)如果存在多种颜色(用于渐变),则返回第一种颜色
height (高度)mobject 的高度。
n_points_per_curve (每条曲线的点数)sheen_factor (光泽因子)stroke_color (描边颜色)width (宽度)mobject 的宽度。
- _create_axis(range_terms, axis_config, length)[source]
创建坐标轴并根据0在直线上的位置动态调整其位置。
- 参数:
range_terms (Sequence[float]) – 坐标轴的范围:
(x_min, x_max, x_step)。axis_config (dict[str, Any]) – 传递给
NumberLine的额外参数。length (float) – 坐标轴的长度。
- 返回:
返回基于
range_terms的数轴。- 返回类型:
数轴
- static _origin_shift(axis_range)[source]
确定当0不在坐标轴上时,如何移动图形mobject进行补偿。
- 参数:
axis_range (Sequence[float]) – 坐标轴的范围:
(x_min, x_max, x_step)。- 返回类型:
浮点数
- _original__init__(x_range=None, y_range=None, x_length=12, y_length=6, axis_config=None, x_axis_config=None, y_axis_config=None, tips=True, **kwargs)
初始化自身。有关准确签名,请参阅 help(type(self))。
- 参数:
x_range (Sequence[float] | None)
y_range (Sequence[float] | None)
x_length (float | None)
y_length (float | None)
axis_config (dict | None)
x_axis_config (dict | None)
y_axis_config (dict | None)
tips (bool)
kwargs (Any)
- 返回类型:
无
- static _update_default_configs(default_configs, passed_configs)[source]
接受两个字典元组,并修改第一个元组,使
passed_configs中的值覆盖default_configs中的值。如果键在 default_configs 中不存在,则将其添加到字典中。此方法有助于在类中设置默认值,并能够通过用户定义输入来覆盖它们。
- 参数:
default_configs (tuple[dict[Any, Any]]) – 将要更新的字典。
passed_configs (tuple[dict[Any, Any]]) – 用于更新的字典。
- 返回类型:
无
示例
要创建只有一个字典的元组,请在元素后添加逗号
self._update_default_configs(
    (dict_1,)(
        dict_2,
    )
)
- coords_to_point(*coords)[source]
接受坐标轴上的坐标,并返回场景中的一个点。等同于 ax @ (coord1)
- 参数:
coords (float | Sequence[float] | Sequence[Sequence[float]] | ndarray) –
坐标。每个坐标都作为单独的参数传递:
ax.coords_to_point(1, 2, 3)。也接受坐标列表
ax.coords_to_point( [x_0, x_1, ...], [y_0, y_1, ...], ... )ax.coords_to_point( [[x_0, y_0, z_0], [x_1, y_1, z_1]] )- 返回:
相对于场景坐标系的一个点。数组的形状将与输入形状相似。
- 返回类型:
np.ndarray
示例
>>> from manim import Axes
>>> import numpy as np
>>> ax = Axes()
>>> np.around(ax.coords_to_point(1, 0, 0), 2)
array([0.86, 0.  , 0.  ])
>>> np.around(ax @ (1, 0, 0), 2)
array([0.86, 0.  , 0.  ])
>>> np.around(ax.coords_to_point([[0, 1], [1, 1], [1, 0]]), 2)
array([[0.  , 0.75, 0.  ],
       [0.86, 0.75, 0.  ],
       [0.86, 0.  , 0.  ]])
>>> np.around(
...     ax.coords_to_point([0, 1, 1], [1, 1, 0]), 2
... )  # Transposed version of the above
array([[0.  , 0.86, 0.86],
       [0.75, 0.75, 0.  ],
       [0.  , 0.  , 0.  ]])
示例: CoordsToPointExample 
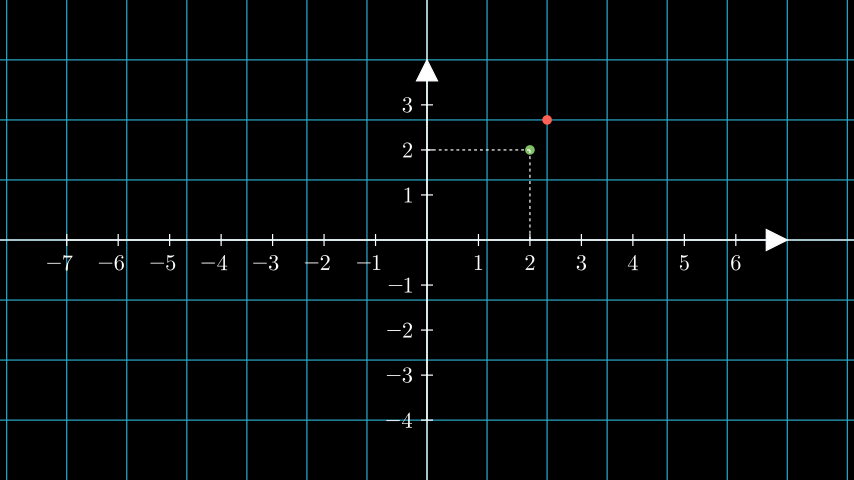
from manim import *

class CoordsToPointExample(Scene):
    def construct(self):
        ax = Axes().add_coordinates()

        # a dot with respect to the axes
        dot_axes = Dot(ax.coords_to_point(2, 2), color=GREEN)
        lines = ax.get_lines_to_point(ax.c2p(2,2))

        # a dot with respect to the scene
        # the default plane corresponds to the coordinates of the scene.
        plane = NumberPlane()
        dot_scene = Dot((2,2,0), color=RED)

        self.add(plane, dot_scene, ax, dot_axes, lines)
- get_axis_labels(x_label='x', y_label='y')[source]
定义图表的x轴和y轴的标签。
为了更好地控制标签的位置,请使用
get_x_axis_label()和get_y_axis_label()。- 参数:
- 返回:
一个由x轴和y轴标签组成的
VGroup。- 返回类型:
示例
示例: GetAxisLabelsExample 
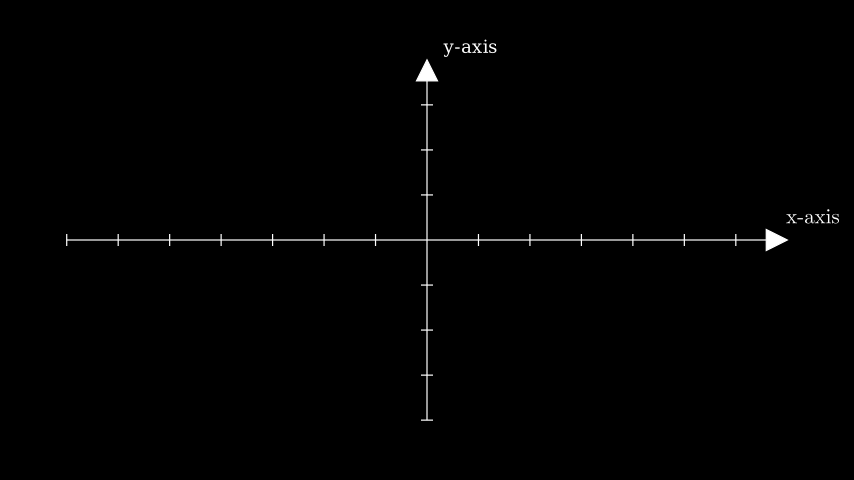
from manim import *

class GetAxisLabelsExample(Scene):
    def construct(self):
        ax = Axes()
        labels = ax.get_axis_labels(
            Tex("x-axis").scale(0.7), Text("y-axis").scale(0.45)
        )
        self.add(ax, labels)
class GetAxisLabelsExample(Scene):
    def construct(self):
        ax = Axes()
        labels = ax.get_axis_labels(
            Tex("x-axis").scale(0.7), Text("y-axis").scale(0.45)
        )
        self.add(ax, labels)
- plot_line_graph(x_values, y_values, z_values=None, line_color=ManimColor('#FFFF00'), add_vertex_dots=True, vertex_dot_radius=0.08, vertex_dot_style=None, **kwargs)[source]
绘制线形图。
该图连接了由
x_values、y_values和z_values压缩形成的顶点。如果add_vertex_dots设置为True,则在顶点处添加Dots。- 参数:
x_values (Iterable[float]) – 沿x轴的值的可迭代对象。
y_values (Iterable[float]) – 沿y轴的值的可迭代对象。
z_values (Iterable[float] | None) – 沿z轴的值的可迭代对象(如果z_values为None则为零)。
line_color (ParsableManimColor) – 折线图的颜色。
add_vertex_dots (bool) – 是否在每个顶点添加
Dot。vertex_dot_radius (float) – 每个顶点处
Dot的半径。vertex_dot_style (dict[str, Any] | None) – 传递给每个顶点处
Dot的样式参数。kwargs (Any) – 传递给
VMobject的额外参数。
- 返回:
一个包含线条和点(如果指定)的 VDict。线条可以通过
line_graph["line_graph"]访问。点可以通过line_graph["vertex_dots"]访问。- 返回类型:
示例
示例: LineGraphExample 
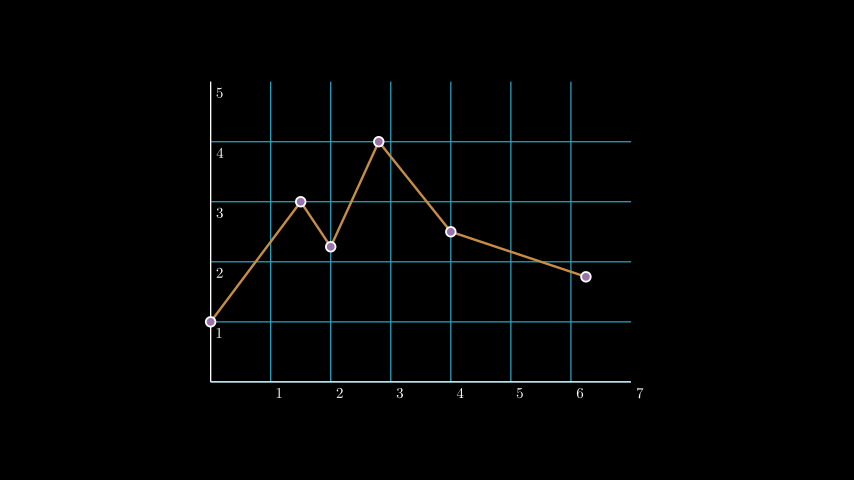
from manim import *

class LineGraphExample(Scene):
    def construct(self):
        plane = NumberPlane(
            x_range = (0, 7),
            y_range = (0, 5),
            x_length = 7,
            axis_config={"include_numbers": True},
        )
        plane.center()
        line_graph = plane.plot_line_graph(
            x_values = [0, 1.5, 2, 2.8, 4, 6.25],
            y_values = [1, 3, 2.25, 4, 2.5, 1.75],
            line_color=GOLD_E,
            vertex_dot_style=dict(stroke_width=3,  fill_color=PURPLE),
            stroke_width = 4,
        )
        self.add(plane, line_graph)
- point_to_coords(point)[source]
接受场景中的一个点,并返回其在坐标轴上的坐标。
- 参数:
point (Sequence[float]) – 点,例如
RIGHT或[0, 1, 0]。也接受点列表,例如[RIGHT, [0, 1, 0]]。- 返回:
坐标轴上的坐标,例如
[4.0, 7.0]。如果 point 是一个点列表,则为坐标列表。- 返回类型:
np.ndarray[float]
示例
>>> from manim import Axes, RIGHT
>>> import numpy as np
>>> ax = Axes(x_range=[0, 10, 2])
>>> np.around(ax.point_to_coords(RIGHT), 2)
array([5.83, 0.  ])
>>> np.around(ax.point_to_coords([[0, 0, 1], [1, 0, 0]]), 2)
array([[5.  , 0.  ],
       [5.83, 0.  ]])
示例: PointToCoordsExample 
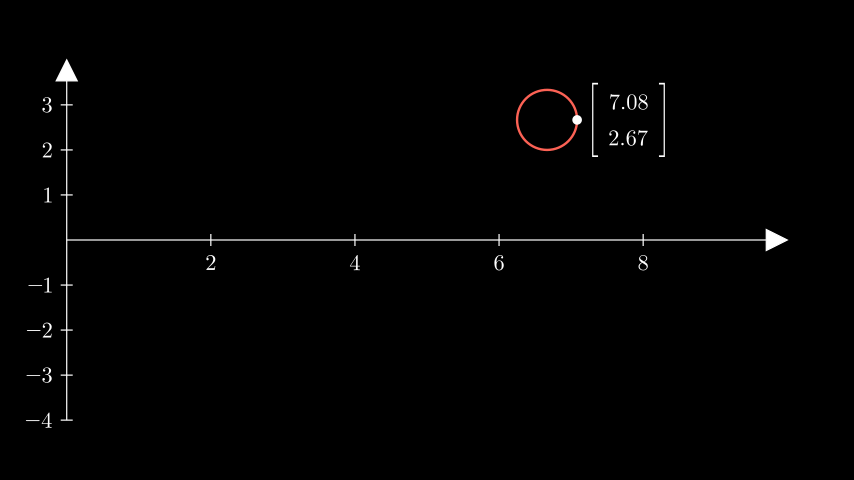
from manim import *

class PointToCoordsExample(Scene):
    def construct(self):
        ax = Axes(x_range=[0, 10, 2]).add_coordinates()
        circ = Circle(radius=0.5).shift(UR * 2)

        # get the coordinates of the circle with respect to the axes
        coords = np.around(ax.point_to_coords(circ.get_right()), decimals=2)

        label = (
            Matrix([[coords[0]], [coords[1]]]).scale(0.75).next_to(circ, RIGHT)
        )

        self.add(ax, circ, label, Dot(circ.get_right()))