CoordinateSystem
Qualified name: manim.mobject.graphing.coordinate\_systems.CoordinateSystem
- class CoordinateSystem(x_range=None, y_range=None, x_length=None, y_length=None, dimension=2)[source]
基类:
objectAxes 和 NumberPlane 的抽象基类。
示例
示例: CoordSysExample 
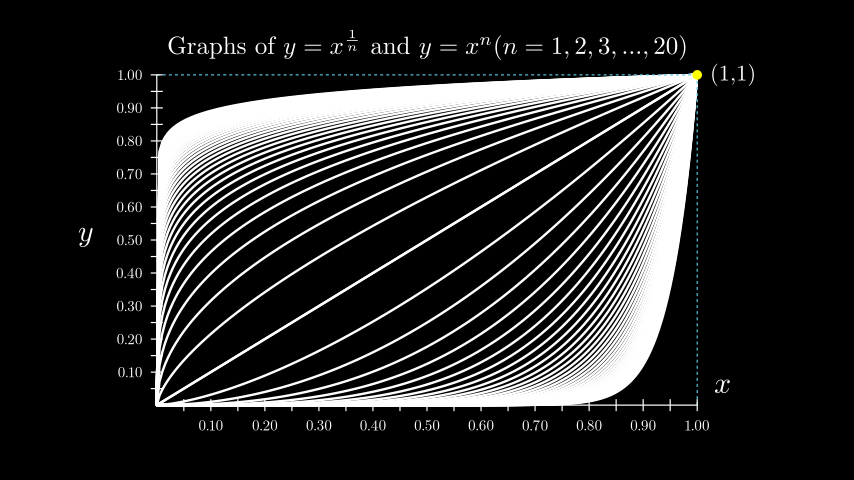
from manim import *

class CoordSysExample(Scene):
    def construct(self):
        # the location of the ticks depends on the x_range and y_range.
        grid = Axes(
            x_range=[0, 1, 0.05],  # step size determines num_decimal_places.
            y_range=[0, 1, 0.05],
            x_length=9,
            y_length=5.5,
            axis_config={
                "numbers_to_include": np.arange(0, 1 + 0.1, 0.1),
                "font_size": 24,
            },
            tips=False,
        )

        # Labels for the x-axis and y-axis.
        y_label = grid.get_y_axis_label("y", edge=LEFT, direction=LEFT, buff=0.4)
        x_label = grid.get_x_axis_label("x")
        grid_labels = VGroup(x_label, y_label)

        graphs = VGroup()
        for n in np.arange(1, 20 + 0.5, 0.5):
            graphs += grid.plot(lambda x: x ** n, color=WHITE)
            graphs += grid.plot(
                lambda x: x ** (1 / n), color=WHITE, use_smoothing=False
            )

        # Extra lines and labels for point (1,1)
        graphs += grid.get_horizontal_line(grid @ (1, 1, 0), color=BLUE)
        graphs += grid.get_vertical_line(grid @ (1, 1, 0), color=BLUE)
        graphs += Dot(point=grid @ (1, 1, 0), color=YELLOW)
        graphs += Tex("(1,1)").scale(0.75).next_to(grid @ (1, 1, 0))
        title = Title(
            # spaces between braces to prevent SyntaxError
            r"Graphs of $y=x^{ {1}\over{n} }$ and $y=x^n (n=1,2,3,...,20)$",
            include_underline=False,
            font_size=40,
        )

        self.add(title, graphs, grid, grid_labels)
方法
为坐标轴添加标签。
返回在特定x值处,绘制曲线的切线与x轴的夹角。
coords_to_point()的缩写。coords_to_point创建一个带标签的三角形标记,其中包含一条从x轴到给定x值处曲线的垂直线。
返回一个表示所传递图形下方区域的
Polygon对象。get_axesget_axisget_axis_labels为所传递的图形创建一个位置恰当的标签,可选择添加一个点。
一条从y轴到场景中给定点的水平线。
返回一条从给定轴到场景中一个点的直线。
生成从坐标轴到某点的水平线和垂直线。
获取
Axes的原点。为给定曲线生成一组黎曼矩形的
VGroup对象。创建两条代表dx和df的线,以及dx和df的标签,和
一条从x轴到场景中给定点的垂直线。
获取从x轴到曲线的多条线。
get_x_axis生成x轴标签。
get_x_unit_sizeget_y_axis生成y轴标签。
get_y_unit_sizeget_z_axis根据给定的x值,返回图上点的轴相对坐标的元组。
返回
graph上对应于x值的点的坐标。point_to_coords()的缩写。根据函数生成曲线。
绘制反导数图。
返回所传递图形的导数曲线。
创建隐函数的曲线。
一条参数曲线。
极坐标图。
根据函数生成曲面。
point_to_coords从点获取极坐标。
从极坐标获取一个点。
polar_to_point()的缩写。point_to_polar()的缩写。返回在特定x值处,绘制曲线的切线的斜率。
- 参数:
x_range (Sequence[float] | None)
y_range (Sequence[float] | None)
x_length (float | None)
y_length (float | None)
dimension (int)
- add_coordinates(*axes_numbers, **kwargs)[source]
为坐标轴添加标签。创建后,使用
Axes.coordinate_labels访问坐标。- 参数:
axes_numbers (Iterable[float] | None | dict[float, str | float | Mobject]) – 要添加到坐标轴的数字。使用
None表示具有默认标签的坐标轴。kwargs (Any)
- 返回类型:
自身
示例
ax = ThreeDAxes()
x_labels = range(-4, 5)
z_labels = range(-4, 4, 2)
ax.add_coordinates(
    x_labels, None, z_labels
)  # default y labels, custom x & z labels
ax.add_coordinates(x_labels)  # only x labels
您还可以使用字典来精确控制标签的位置和值。
ax = Axes(x_range=[0, 7])
x_pos = [x for x in range(1, 8)]

# strings are automatically converted into a Tex mobject.
x_vals = [
    "Monday",
    "Tuesday",
    "Wednesday",
    "Thursday",
    "Friday",
    "Saturday",
    "Sunday",
]
x_dict = dict(zip(x_pos, x_vals))
ax.add_coordinates(x_dict)
- angle_of_tangent(x, graph, dx=1e-08)[source]
返回在特定x值处,绘制曲线的切线与x轴的夹角。
- 参数:
x (float) – 切线必须与曲线相切的x值。
graph (ParametricFunction) – 用于计算切线的
ParametricFunction。dx (float) – 用于确定曲线切线角度的x的变化量。
- 返回:
曲线切线的角度。
- 返回类型:
浮点数
示例
ax = Axes()
curve = ax.plot(lambda x: x**2)
ax.angle_of_tangent(x=3, graph=curve)
# 1.4056476493802699
- c2p(*coords)[source]
coords_to_point()的缩写。- 参数:
coords (float | Sequence[float] | Sequence[Sequence[float]] | ndarray)
- 返回类型:
ndarray
- get_T_label(x_val, graph, label=None, label_color=None, triangle_size=0.25, triangle_color=ManimColor('#FFFFFF'), line_func=<class 'manim.mobject.geometry.line.Line'>, line_color=ManimColor('#FFFF00'))[source]
创建一个带标签的三角形标记,其中包含一条从x轴到给定x值处曲线的垂直线。
- 参数:
x_val (float) – 沿着曲线上构建标签、线和三角形的位置。
graph (ParametricFunction) – 用于构建标签的
ParametricFunction。label (float | str | Mobject | None) – 垂直线和三角形的标签。
label_color (ParsableManimColor | None) – 标签的颜色。
triangle_size (float) – 三角形的大小。
triangle_color (ParsableManimColor | None) – 三角形的颜色。
line_func (type[Line]) – 用于构建垂直线的函数。
line_color (ParsableManimColor) – 垂直线的颜色。
- 返回:
标签、三角形和垂直线mobject组成的
VGroup对象。- 返回类型:
示例
示例: TLabelExample 
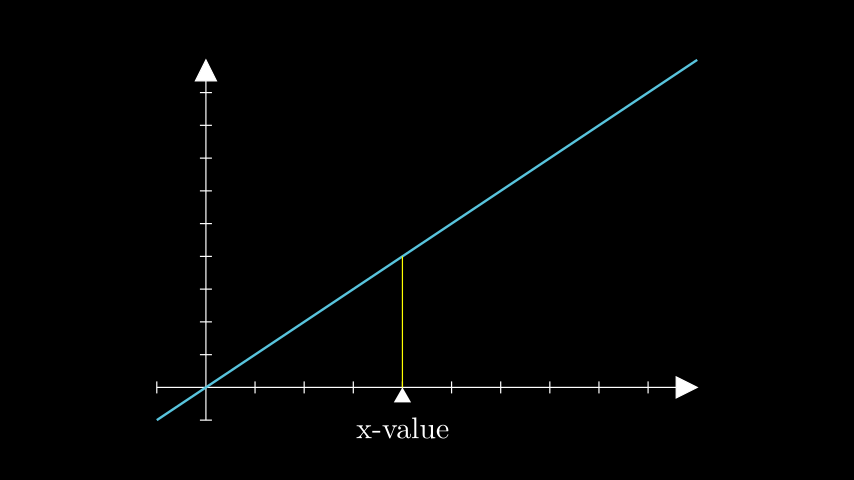
from manim import *

class TLabelExample(Scene):
    def construct(self):
        # defines the axes and linear function
        axes = Axes(x_range=[-1, 10], y_range=[-1, 10], x_length=9, y_length=6)
        func = axes.plot(lambda x: x, color=BLUE)
        # creates the T_label
        t_label = axes.get_T_label(x_val=4, graph=func, label=Tex("x-value"))
        self.add(axes, func, t_label)
- get_area(graph, x_range=None, color=(ManimColor('#58C4DD'), ManimColor('#83C167')), opacity=0.3, bounded_graph=None, **kwargs)[source]
返回一个表示所传递图形下方区域的
Polygon对象。- 参数:
graph (ParametricFunction) – 需要获取面积的图形/曲线。
x_range (tuple[float, float] | None) – 区域的x值最小和最大范围。
x_range = [x_min, x_max]。color (ParsableManimColor | Iterable[ParsableManimColor]) – 区域的颜色。如果提供颜色列表,则创建渐变色。
opacity (float) – 区域的不透明度。
bounded_graph (ParametricFunction) – 如果指定了第二个
graph,则包围两条曲线之间的区域。kwargs (Any) – 传递给
Polygon的额外参数。
- 返回:
表示该区域的
Polygon对象。- 返回类型:
- 抛出:
ValueError – 当x范围不匹配时(无论是区域的x范围、图形的x范围还是bounded_graph的x范围)。
示例
示例: GetAreaExample 
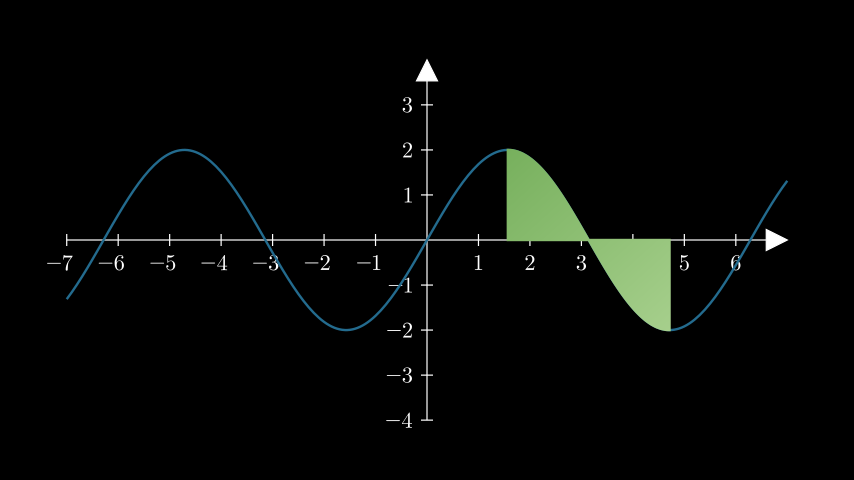
from manim import *

class GetAreaExample(Scene):
    def construct(self):
        ax = Axes().add_coordinates()
        curve = ax.plot(lambda x: 2 * np.sin(x), color=DARK_BLUE)
        area = ax.get_area(
            curve,
            x_range=(PI / 2, 3 * PI / 2),
            color=(GREEN_B, GREEN_D),
            opacity=1,
        )

        self.add(ax, curve, area)
- get_graph_label(graph, label='f(x)', x_val=None, direction=array([1., 0., 0.]), buff=0.25, color=None, dot=False, dot_config=None)[source]
为所传递的图形创建一个位置恰当的标签,可选择添加一个点。
- 参数:
graph (ParametricFunction) – 曲线。
label (float | str | Mobject) – 函数曲线的标签。对于
str和float输入,默认为MathTex。x_val (float | None) – 沿曲线定位标签的x值。
direction (Sequence[float]) – 标签相对于曲线的笛卡尔位置 —>
LEFT,RIGHT。buff (float) – 曲线与标签之间的距离。
color (ParsableManimColor | None) – 标签的颜色。默认为曲线的颜色。
dot (bool) – 是否在图上的点添加一个点。
dot_config (dict[str, Any] | None) – 传递给
Dot的额外参数。
- 返回:
已定位的标签和
Dot(如果适用)。- 返回类型:
Mobject
示例
示例: GetGraphLabelExample 
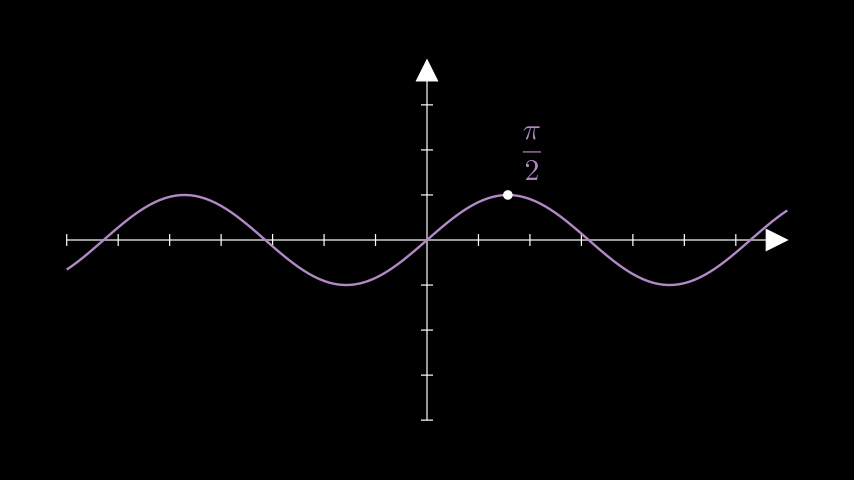
from manim import *

class GetGraphLabelExample(Scene):
    def construct(self):
        ax = Axes()
        sin = ax.plot(lambda x: np.sin(x), color=PURPLE_B)
        label = ax.get_graph_label(
            graph=sin,
            label= MathTex(r"\frac{\pi}{2}"),
            x_val=PI / 2,
            dot=True,
            direction=UR,
        )

        self.add(ax, sin, label)
- get_horizontal_line(point, **kwargs)[source]
一条从y轴到场景中给定点的水平线。
- 参数:
point (Sequence[float]) – 将绘制水平线的点。
kwargs – 传递给
get_line_from_axis_to_point的额外参数。
- 返回:
一条从y轴到该点的水平线。
- 返回类型:
Line
示例
示例: GetHorizontalLineExample 
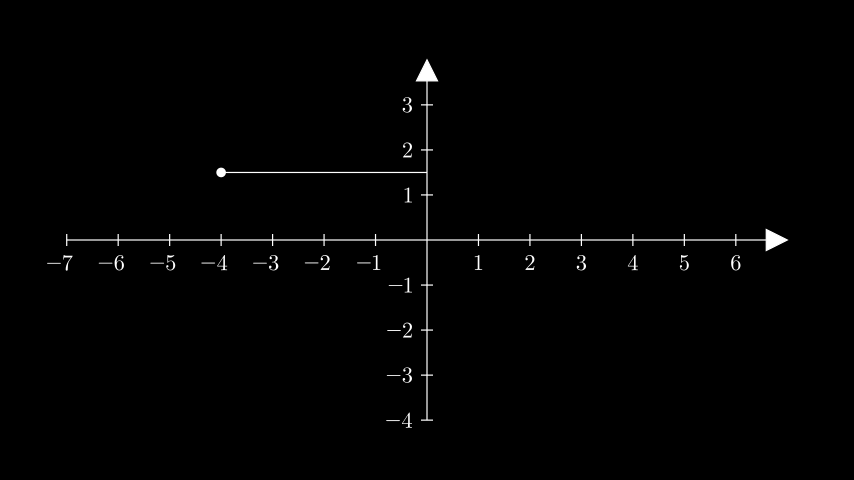
from manim import *

class GetHorizontalLineExample(Scene):
    def construct(self):
        ax = Axes().add_coordinates()
        point = ax @ (-4, 1.5)

        dot = Dot(point)
        line = ax.get_horizontal_line(point, line_func=Line)

        self.add(ax, line, dot)
class GetHorizontalLineExample(Scene):
    def construct(self):
        ax = Axes().add_coordinates()
        point = ax @ (-4, 1.5)

        dot = Dot(point)
        line = ax.get_horizontal_line(point, line_func=Line)

        self.add(ax, line, dot)
- get_line_from_axis_to_point(index: int, point: Sequence[float], line_config: dict | None = None, color: ParsableManimColor | None = None, stroke_width: float = 2) DashedLine[source]
- get_line_from_axis_to_point(index: int, point: Sequence[float], line_func: type[LineType], line_config: dict | None = None, color: ParsableManimColor | None = None, stroke_width: float = 2) LineType
返回一条从给定轴到场景中一个点的直线。
- get_lines_to_point(point, **kwargs)[source]
生成从坐标轴到某点的水平线和垂直线。
- 参数:
point (Sequence[float]) – 场景中的一个点。
kwargs – 传递给
get_line_from_axis_to_point()的额外参数。
- 返回:
由水平线和垂直线组成的
VGroup。- 返回类型:
示例
示例:GetLinesToPointExample 
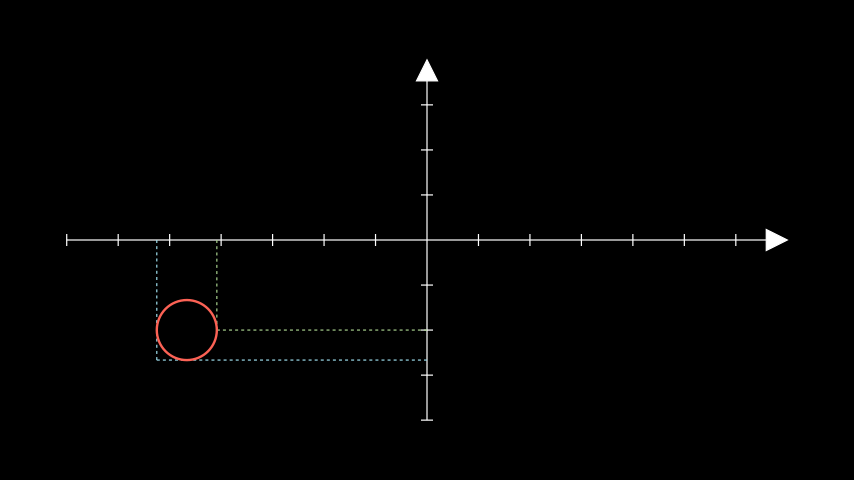
from manim import *

class GetLinesToPointExample(Scene):
    def construct(self):
        ax = Axes()
        circ = Circle(radius=0.5).move_to([-4, -1.5, 0])

        lines_1 = ax.get_lines_to_point(circ.get_right(), color=GREEN_B)
        lines_2 = ax.get_lines_to_point(circ.get_corner(DL), color=BLUE_B)
        self.add(ax, lines_1, lines_2, circ)
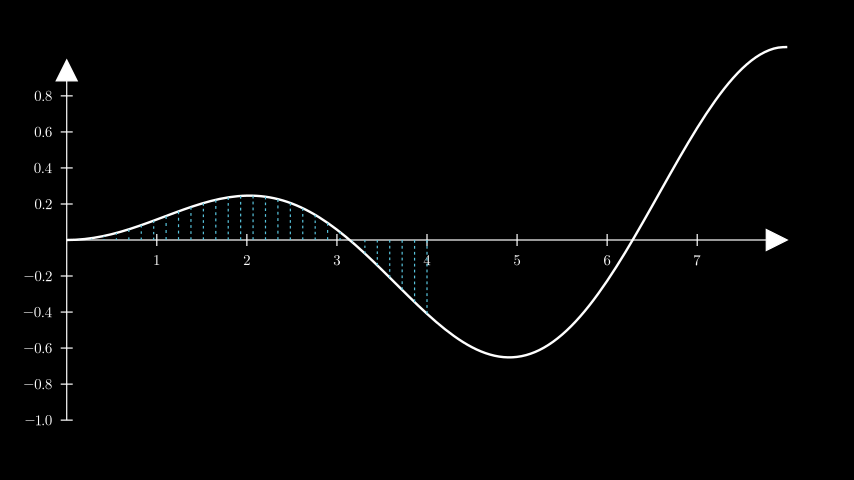
- get_riemann_rectangles(graph, x_range=None, dx=0.1, input_sample_type='left', stroke_width=1, stroke_color=ManimColor('#000000'), fill_opacity=1, color=(ManimColor('#58C4DD'), ManimColor('#83C167')), show_signed_area=True, bounded_graph=None, blend=False, width_scale_factor=1.001)[source]
为给定曲线生成一组黎曼矩形的
VGroup对象。- 参数:
graph (ParametricFunction) – 将由黎曼矩形近似计算其面积的图。
x_range (Sequence[float] | None) – 矩形的最小和最大 x 值。
x_range = [x_min, x_max]。dx (float | None) – 分隔每个矩形的 x 值变化量。
input_sample_type (str) – 可以是
"left"、"right"或"center"之一。指每个黎曼矩形高度的采样点将位于分区段的何处。stroke_width (float) – 矩形边框的描边宽度。
stroke_color (ParsableManimColor) – 矩形边框的颜色。
fill_opacity (float) – 矩形的不透明度。
color (Iterable[ParsableManimColor] | ParsableManimColor) – 矩形的颜色。如果传入多种颜色,则创建平衡的渐变。
show_signed_area (bool) – 当曲线低于 x 轴时,通过反转颜色来表示负面积。
blend (bool) – 将
stroke_color设置为fill_color,使矩形融合而无明显分隔。bounded_graph (ParametricFunction) – 如果指定了第二个图,则围住两条曲线之间的区域。
width_scale_factor (float) – 矩形宽度缩放的因子。
- 返回:
包含黎曼矩形的
VGroup。- 返回类型:
示例
示例:GetRiemannRectanglesExample 
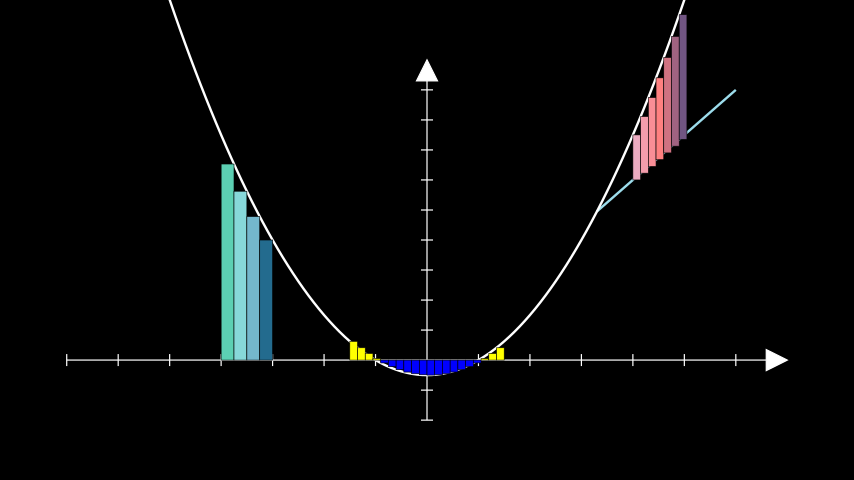
from manim import *

class GetRiemannRectanglesExample(Scene):
    def construct(self):
        ax = Axes(y_range=[-2, 10])
        quadratic = ax.plot(lambda x: 0.5 * x ** 2 - 0.5)

        # the rectangles are constructed from their top right corner.
        # passing an iterable to `color` produces a gradient
        rects_right = ax.get_riemann_rectangles(
            quadratic,
            x_range=[-4, -3],
            dx=0.25,
            color=(TEAL, BLUE_B, DARK_BLUE),
            input_sample_type="right",
        )

        # the colour of rectangles below the x-axis is inverted
        # due to show_signed_area
        rects_left = ax.get_riemann_rectangles(
            quadratic, x_range=[-1.5, 1.5], dx=0.15, color=YELLOW
        )

        bounding_line = ax.plot(
            lambda x: 1.5 * x, color=BLUE_B, x_range=[3.3, 6]
        )
        bounded_rects = ax.get_riemann_rectangles(
            bounding_line,
            bounded_graph=quadratic,
            dx=0.15,
            x_range=[4, 5],
            show_signed_area=False,
            color=(MAROON_A, RED_B, PURPLE_D),
        )

        self.add(
            ax, bounding_line, quadratic, rects_right, rects_left, bounded_rects
        )
- get_secant_slope_group(x, graph, dx=None, dx_line_color=ManimColor('#FFFF00'), dy_line_color=None, dx_label=None, dy_label=None, include_secant_line=True, secant_line_color=ManimColor('#83C167'), secant_line_length=10)[source]
- 创建两条代表dx和df的线,以及dx和df的标签,和
曲线上特定 x 值的割线。
- 参数:
x (float) – 割线首次与图相交的 x 值。
graph (ParametricFunction) – 将找到割线的曲线。
dx (float | None) – 割线离开后 x 的变化量。
dx_line_color (ParsableManimColor) – 指示 x 变化量的线的颜色。
dy_line_color (ParsableManimColor | None) – 指示 y 变化量的线的颜色。默认为
graph的颜色。dx_label (float | str | None) – dx 线的标签。对于
str和float输入,默认为MathTex。dy_label (float | str | None) – dy 线的标签。对于
str和float输入,默认为MathTex。include_secant_line (bool) – 是否在图中包含割线,或者只包含 df/dx 线和标签。
secant_line_color (ParsableManimColor) – 割线的颜色。
secant_line_length (float) – 割线的长度。
- 返回:
一个包含以下元素的组: dx_line、 df_line,如果适用,还包括
dx_label、df_label、 secant_line。- 返回类型:
示例
示例:GetSecantSlopeGroupExample 
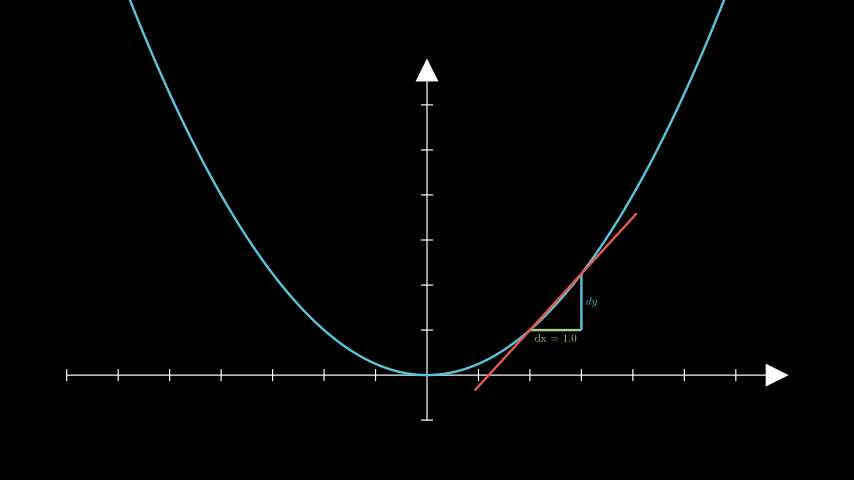
from manim import *

class GetSecantSlopeGroupExample(Scene):
    def construct(self):
        ax = Axes(y_range=[-1, 7])
        graph = ax.plot(lambda x: 1 / 4 * x ** 2, color=BLUE)
        slopes = ax.get_secant_slope_group(
            x=2.0,
            graph=graph,
            dx=1.0,
            dx_label=Tex("dx = 1.0"),
            dy_label="dy",
            dx_line_color=GREEN_B,
            secant_line_length=4,
            secant_line_color=RED_D,
        )

        self.add(ax, graph, slopes)
- get_vertical_line(point, **kwargs)[source]
一条从x轴到场景中给定点的垂直线。
- 参数:
point (Sequence[float]) – 垂直线将绘制到的点。
kwargs (Any) – 传递给
get_line_from_axis_to_point的额外参数。
- 返回:
从 x 轴到该点的垂直线。
- 返回类型:
Line
示例
示例:GetVerticalLineExample 
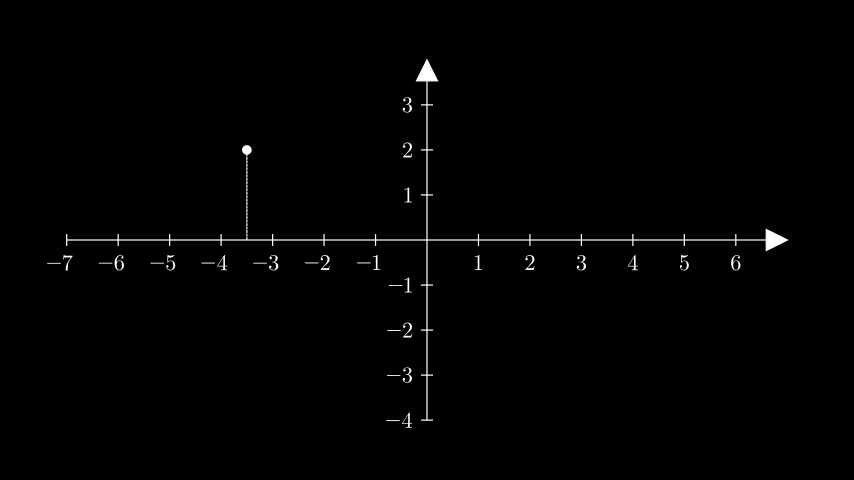
from manim import *

class GetVerticalLineExample(Scene):
    def construct(self):
        ax = Axes().add_coordinates()
        point = ax.coords_to_point(-3.5, 2)

        dot = Dot(point)
        line = ax.get_vertical_line(point, line_config={"dashed_ratio": 0.85})

        self.add(ax, line, dot)
class GetVerticalLineExample(Scene):
    def construct(self):
        ax = Axes().add_coordinates()
        point = ax.coords_to_point(-3.5, 2)

        dot = Dot(point)
        line = ax.get_vertical_line(point, line_config={"dashed_ratio": 0.85})

        self.add(ax, line, dot)
- get_vertical_lines_to_graph(graph, x_range=None, num_lines=20, **kwargs)[source]
获取从x轴到曲线的多条线。
- 参数:
graph (ParametricFunction) – 线将沿其放置的图。
x_range (Sequence[float] | None) – 一个包含线段下限和上限的列表:
x_range = [x_min, x_max]。num_lines (int) – 等间距线的数量。
kwargs (Any) – 传递给
get_vertical_line()的额外参数。
- 返回:
等间距线的
VGroup。- 返回类型:
示例
示例:GetVerticalLinesToGraph 
from manim import *

class GetVerticalLinesToGraph(Scene):
    def construct(self):
        ax = Axes(
            x_range=[0, 8.0, 1],
            y_range=[-1, 1, 0.2],
            axis_config={"font_size": 24},
        ).add_coordinates()

        curve = ax.plot(lambda x: np.sin(x) / np.e ** 2 * x)

        lines = ax.get_vertical_lines_to_graph(
            curve, x_range=[0, 4], num_lines=30, color=BLUE
        )

        self.add(ax, curve, lines)
- get_x_axis_label(label, edge=array([1., 1., 0.]), direction=array([1., 1., 0.]), buff=0.1, **kwargs)[source]
生成x轴标签。
- 参数:
- 返回:
已定位的标签。
- 返回类型:
示例
示例:GetXAxisLabelExample 
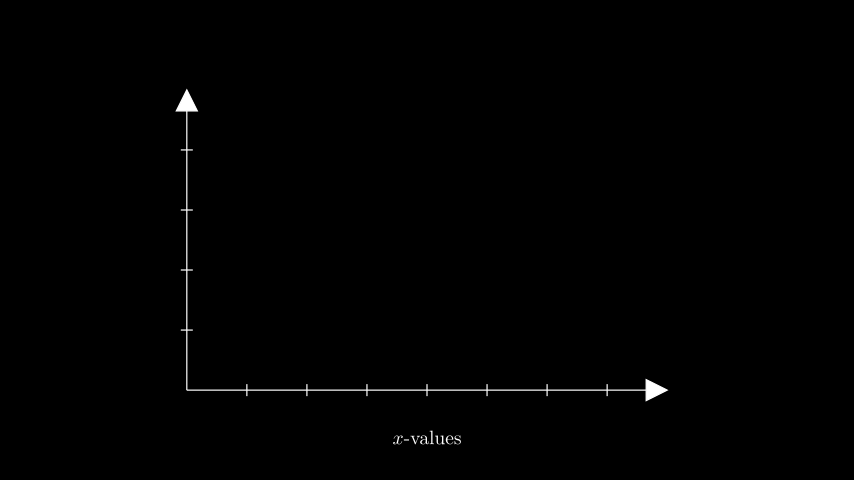
from manim import *

class GetXAxisLabelExample(Scene):
    def construct(self):
        ax = Axes(x_range=(0, 8), y_range=(0, 5), x_length=8, y_length=5)
        x_label = ax.get_x_axis_label(
            Tex("$x$-values").scale(0.65), edge=DOWN, direction=DOWN, buff=0.5
        )
        self.add(ax, x_label)
class GetXAxisLabelExample(Scene):
    def construct(self):
        ax = Axes(x_range=(0, 8), y_range=(0, 5), x_length=8, y_length=5)
        x_label = ax.get_x_axis_label(
            Tex("$x$-values").scale(0.65), edge=DOWN, direction=DOWN, buff=0.5
        )
        self.add(ax, x_label)
- get_y_axis_label(label, edge=array([1., 1., 0.]), direction=array([1., 0.5, 0.]), buff=0.1, **kwargs)[source]
生成y轴标签。
- 参数:
- 返回:
已定位的标签。
- 返回类型:
示例
示例:GetYAxisLabelExample 
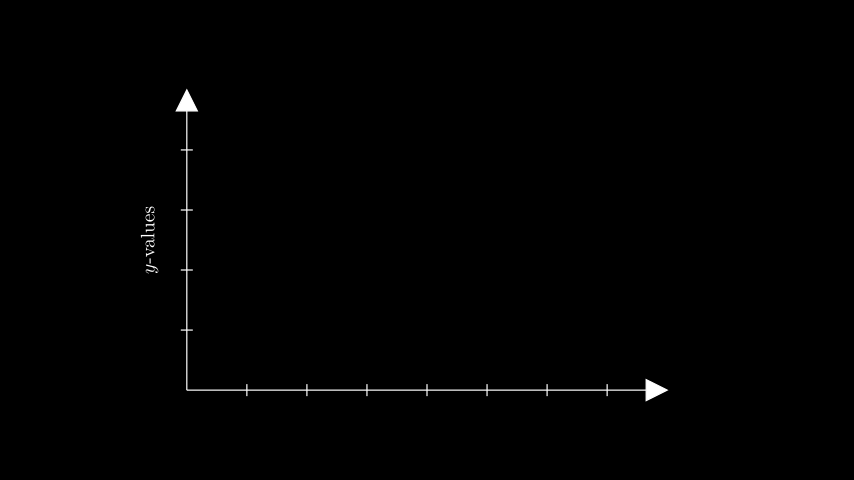
from manim import *

class GetYAxisLabelExample(Scene):
    def construct(self):
        ax = Axes(x_range=(0, 8), y_range=(0, 5), x_length=8, y_length=5)
        y_label = ax.get_y_axis_label(
            Tex("$y$-values").scale(0.65).rotate(90 * DEGREES),
            edge=LEFT,
            direction=LEFT,
            buff=0.3,
        )
        self.add(ax, y_label)
- i2gc(x, graph)[source]
-
- 参数:
x (float)
graph (ParametricFunction)
- 返回类型:
tuple[float, float]
- i2gp(x, graph)[source]
-
- 参数:
x (float)
graph (ParametricFunction)
- 返回类型:
ndarray
- input_to_graph_coords(x, graph)[source]
根据给定的x值,返回图上点的轴相对坐标的元组。
示例
>>> from manim import Axes
>>> ax = Axes()
>>> parabola = ax.plot(lambda x: x**2)
>>> ax.input_to_graph_coords(x=3, graph=parabola)
(3, 9)
- 参数:
x (float)
graph (ParametricFunction)
- 返回类型:
tuple[float, float]
- input_to_graph_point(x, graph)[source]
返回
graph上对应于x值的点的坐标。- 参数:
x (float) –
graph上一个点的 x 值。graph (ParametricFunction | VMobject) – 点所在的
ParametricFunction。
- 返回:
graph上对应x值的点的坐标。- 返回类型:
np.ndarray- 抛出:
ValueError – 当目标 x 不在线图的范围内时。
示例
示例:InputToGraphPointExample 
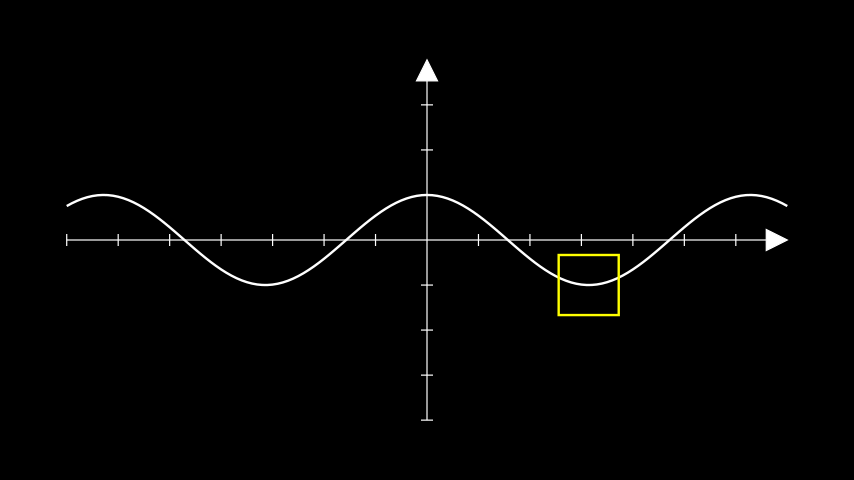
from manim import *

class InputToGraphPointExample(Scene):
    def construct(self):
        ax = Axes()
        curve = ax.plot(lambda x : np.cos(x))

        # move a square to PI on the cosine curve.
        position = ax.input_to_graph_point(x=PI, graph=curve)
        sq = Square(side_length=1, color=YELLOW).move_to(position)

        self.add(ax, curve, sq)
- p2c(point)[source]
point_to_coords()的缩写。- 参数:
point (Point3DLike)
- plot(function, x_range=None, use_vectorized=False, colorscale=None, colorscale_axis=1, **kwargs)[source]
根据函数生成曲线。
- 参数:
function (Callable[[float], float]) – 用于构建
ParametricFunction的函数。x_range (Sequence[float] | None) – 曲线沿坐标轴的范围。
x_range = [x_min, x_max, x_step]。use_vectorized (bool) – 是否将生成的 t 值数组传递给函数。仅当您的函数支持此功能时才使用。输出应为形状为
[y_0, y_1, ...]的 numpy 数组。colorscale (Union[Iterable[Color], Iterable[Color, float]] | ParsableManimColor) – 函数的颜色。根据值对函数着色时使用的可选参数。传入颜色列表和 colorscale_axis 将根据 y 值对函数着色。传入
(color, pivot)形式的元组列表允许用户定义颜色过渡的枢轴点。colorscale_axis (int) – 定义应用颜色刻度线的坐标轴(0 = x,1 = y),默认为 y 轴 (1)。
kwargs (Any) – 传递给
ParametricFunction的额外参数。
- 返回:
绘制的曲线。
- 返回类型:
警告
此方法可能无法生成精确的图表,因为 Manim 目前依赖于曲线等距采样点之间的插值,而非智能绘图。有关此问题的一些解决方案,请参见以下示例。
示例
示例:PlotExample 
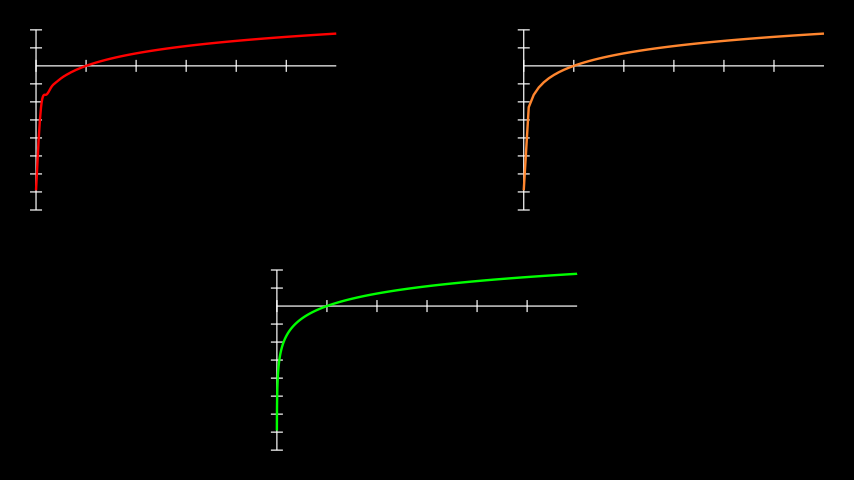
from manim import *

class PlotExample(Scene):
    def construct(self):
        # construct the axes
        ax_1 = Axes(
            x_range=[0.001, 6],
            y_range=[-8, 2],
            x_length=5,
            y_length=3,
            tips=False,
        )
        ax_2 = ax_1.copy()
        ax_3 = ax_1.copy()

        # position the axes
        ax_1.to_corner(UL)
        ax_2.to_corner(UR)
        ax_3.to_edge(DOWN)
        axes = VGroup(ax_1, ax_2, ax_3)

        # create the logarithmic curves
        def log_func(x):
            return np.log(x)

        # a curve without adjustments; poor interpolation.
        curve_1 = ax_1.plot(log_func, color=PURE_RED)

        # disabling interpolation makes the graph look choppy as not enough
        # inputs are available
        curve_2 = ax_2.plot(log_func, use_smoothing=False, color=ORANGE)

        # taking more inputs of the curve by specifying a step for the
        # x_range yields expected results, but increases rendering time.
        curve_3 = ax_3.plot(
            log_func, x_range=(0.001, 6, 0.001), color=PURE_GREEN
        )

        curves = VGroup(curve_1, curve_2, curve_3)

        self.add(axes, curves)
- plot_antiderivative_graph(graph, y_intercept=0, samples=50, use_vectorized=False, **kwargs)[source]
绘制反导数图。
- 参数:
graph (ParametricFunction) – 用于计算反导数的图。
y_intercept (float) – 图形与y轴的截距的y值。
samples (int) – 用于计算图下面积的点数。
use_vectorized (bool) – 是否使用反导数的向量化版本。这意味着将生成的 t 值数组传递给函数。仅当您的函数支持时才使用此选项。输出应为形状为
[y_0, y_1, ...]的 numpy 数组。kwargs (Any) –
ParametricFunction的任何有效关键字参数。
- 返回:
反导数的曲线。
- 返回类型:
注意
此图是从参考图下方的面积值绘制的。如果参考图包含从 x=0 起无法计算的面积,则结果可能不理想。
示例
示例:AntiderivativeExample 
from manim import *

class AntiderivativeExample(Scene):
    def construct(self):
        ax = Axes()
        graph1 = ax.plot(
            lambda x: (x ** 2 - 2) / 3,
            color=RED,
        )
        graph2 = ax.plot_antiderivative_graph(graph1, color=BLUE)
        self.add(ax, graph1, graph2)
class AntiderivativeExample(Scene):
    def construct(self):
        ax = Axes()
        graph1 = ax.plot(
            lambda x: (x ** 2 - 2) / 3,
            color=RED,
        )
        graph2 = ax.plot_antiderivative_graph(graph1, color=BLUE)
        self.add(ax, graph1, graph2)
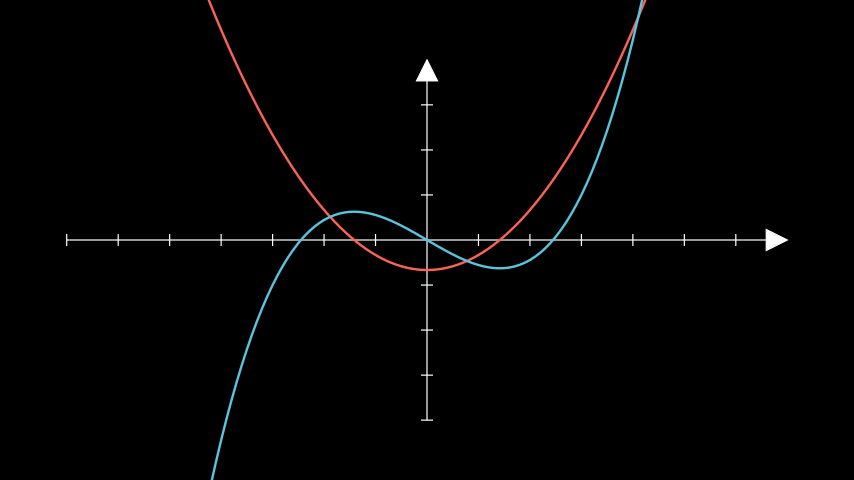
- plot_derivative_graph(graph, color=ManimColor('#83C167'), **kwargs)[source]
返回所传递图形的导数曲线。
- 参数:
graph (ParametricFunction) – 用于计算导数的图。
color (ParsableManimColor) – 导数曲线的颜色。
kwargs –
ParametricFunction的任何有效关键字参数。
- 返回:
导数的曲线。
- 返回类型:
示例
示例:DerivativeGraphExample 
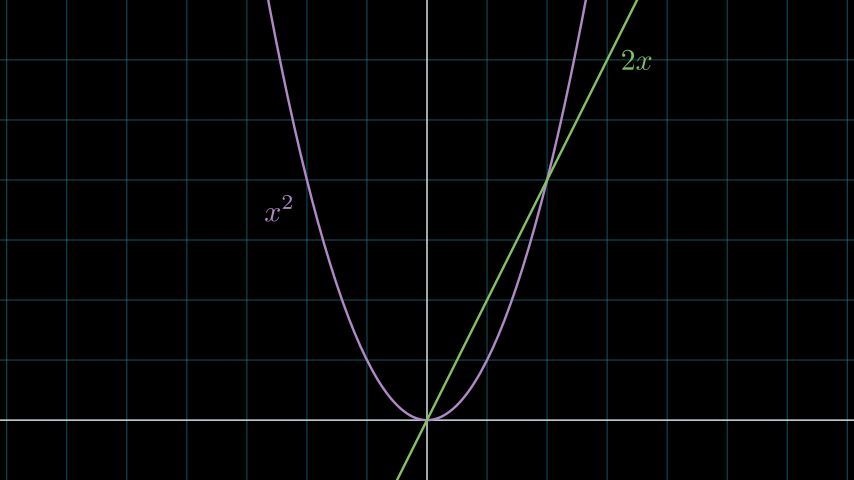
from manim import *

class DerivativeGraphExample(Scene):
    def construct(self):
        ax = NumberPlane(y_range=[-1, 7], background_line_style={"stroke_opacity": 0.4})

        curve_1 = ax.plot(lambda x: x ** 2, color=PURPLE_B)
        curve_2 = ax.plot_derivative_graph(curve_1)
        curves = VGroup(curve_1, curve_2)

        label_1 = ax.get_graph_label(curve_1, "x^2", x_val=-2, direction=DL)
        label_2 = ax.get_graph_label(curve_2, "2x", x_val=3, direction=RIGHT)
        labels = VGroup(label_1, label_2)

        self.add(ax, curves, labels)
- plot_implicit_curve(func, min_depth=5, max_quads=1500, **kwargs)[source]
创建隐函数的曲线。
- 参数:
func (Callable[[float, float], float]) – 要绘制的函数,形式为 f(x, y) = 0。
min_depth (int) – 函数计算的最小深度。
max_quads (int) – 要使用的最大四边形数量。
kwargs (Any) – 传递给
ImplicitFunction的额外参数。
- 返回类型:
示例
示例:ImplicitExample 
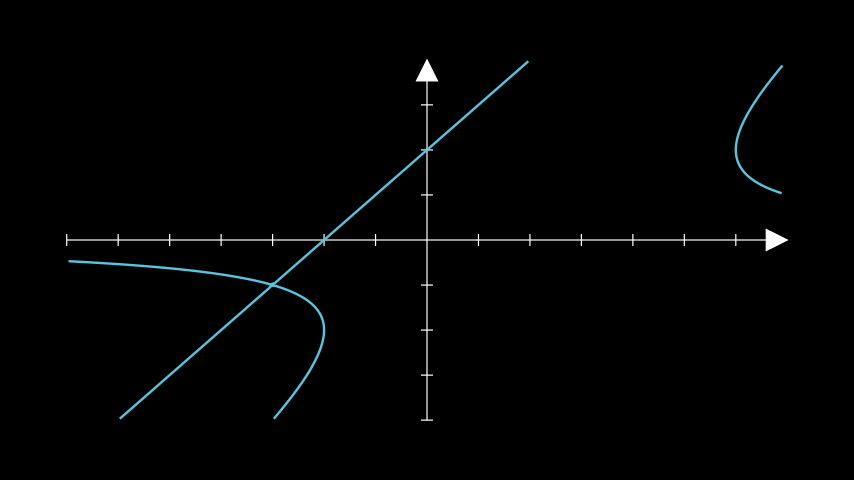
from manim import *

class ImplicitExample(Scene):
    def construct(self):
        ax = Axes()
        a = ax.plot_implicit_curve(
            lambda x, y: y * (x - y) ** 2 - 4 * x - 8, color=BLUE
        )
        self.add(ax, a)
class ImplicitExample(Scene):
    def construct(self):
        ax = Axes()
        a = ax.plot_implicit_curve(
            lambda x, y: y * (x - y) ** 2 - 4 * x - 8, color=BLUE
        )
        self.add(ax, a)
- plot_parametric_curve(function, use_vectorized=False, **kwargs)[source]
一条参数曲线。
- 参数:
function (Callable[[float], ndarray]) – 一个将数字映射到坐标系中点的参数函数。
use_vectorized (bool) – 是否将生成的 t 值数组传递给函数。仅当您的函数支持时才使用此选项。
kwargs (Any) – 任何其他关键字参数都将传递给
ParametricFunction。
- 返回类型:
示例
示例:ParametricCurveExample 
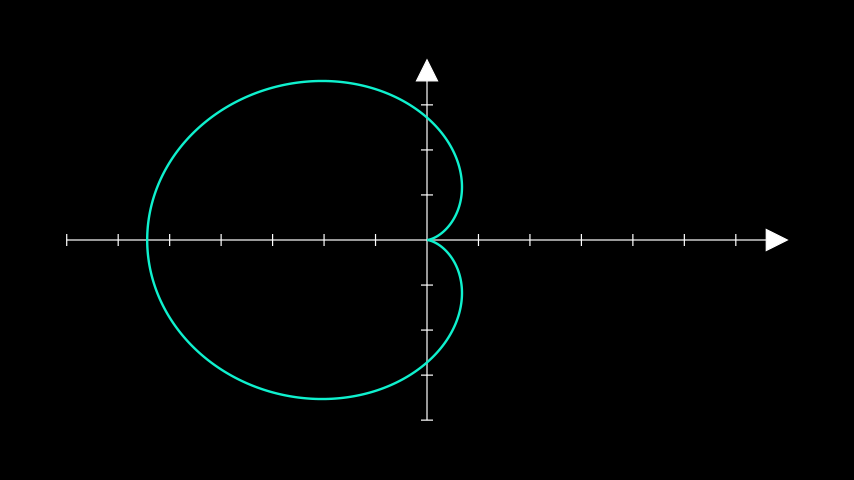
from manim import *

class ParametricCurveExample(Scene):
    def construct(self):
        ax = Axes()
        cardioid = ax.plot_parametric_curve(
            lambda t: np.array(
                [
                    np.exp(1) * np.cos(t) * (1 - np.cos(t)),
                    np.exp(1) * np.sin(t) * (1 - np.cos(t)),
                    0,
                ]
            ),
            t_range=[0, 2 * PI],
            color="#0FF1CE",
        )
        self.add(ax, cardioid)
- plot_polar_graph(r_func, theta_range=None, **kwargs)[source]
极坐标图。
- 参数:
r_func (Callable[[float], float]) – r 对 theta 的函数。
theta_range (Sequence[float] | None) – theta 的范围,格式为
theta_range = [theta_min, theta_max, theta_step]。kwargs (Any) – 传递给
ParametricFunction的额外参数。
- 返回类型:
示例
示例:PolarGraphExample 
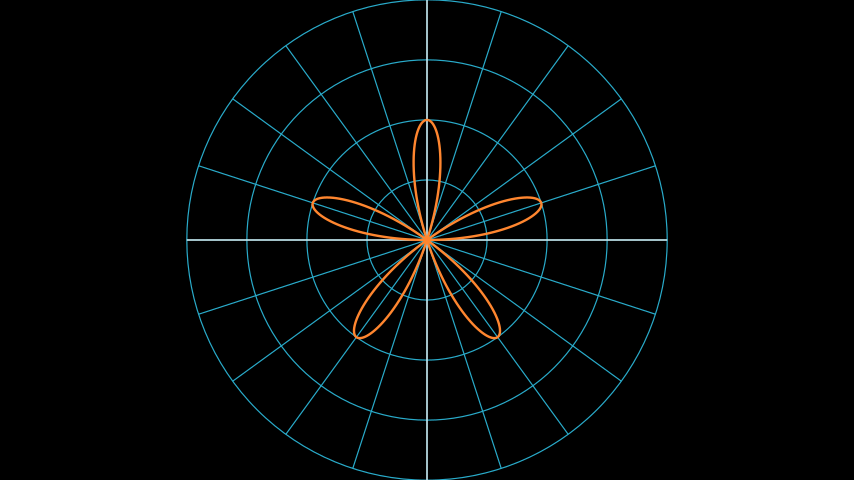
from manim import *

class PolarGraphExample(Scene):
    def construct(self):
        plane = PolarPlane()
        r = lambda theta: 2 * np.sin(theta * 5)
        graph = plane.plot_polar_graph(r, [0, 2 * PI], color=ORANGE)
        self.add(plane, graph)
class PolarGraphExample(Scene):
    def construct(self):
        plane = PolarPlane()
        r = lambda theta: 2 * np.sin(theta * 5)
        graph = plane.plot_polar_graph(r, [0, 2 * PI], color=ORANGE)
        self.add(plane, graph)
参考:
PolarPlane
- plot_surface(function, u_range=None, v_range=None, colorscale=None, colorscale_axis=2, **kwargs)[source]
根据函数生成曲面。
- 参数:
function (Callable[[float], float]) – 用于构建
Surface的函数。u_range (Sequence[float] | None) –
u变量的范围:(u_min, u_max)。v_range (Sequence[float] | None) –
v变量的范围:(v_min, v_max)。colorscale (Sequence[ParsableManimColor] | Sequence[tuple[ParsableManimColor, float]] | None) – 曲面的颜色。传入颜色列表将按 z 值对曲面着色。传入
(color, pivot)形式的元组列表允许用户定义颜色过渡的枢轴点。colorscale_axis (int) – 定义应用颜色刻度轴(0 = x,1 = y,2 = z),默认为 z 轴 (2)。
kwargs (Any) – 传递给
Surface的额外参数。
- 返回:
绘制的曲面。
- 返回类型:
示例
示例:PlotSurfaceExample 
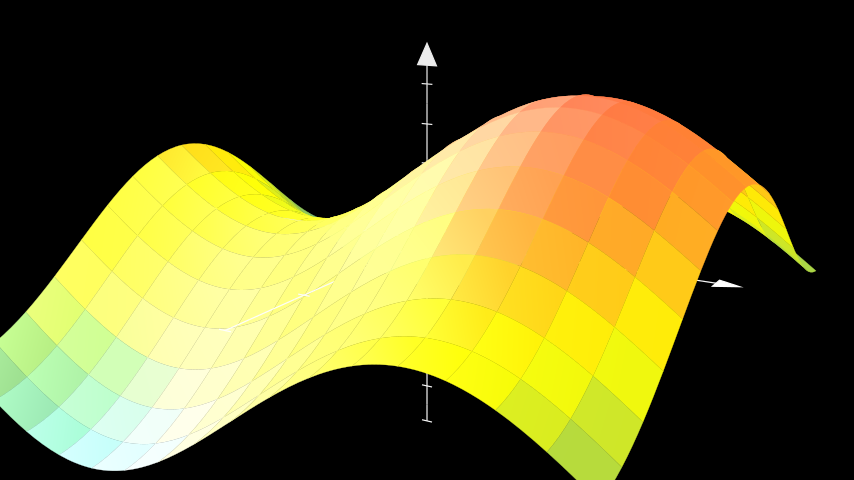
from manim import *

class PlotSurfaceExample(ThreeDScene):
    def construct(self):
        resolution_fa = 16
        self.set_camera_orientation(phi=75 * DEGREES, theta=-60 * DEGREES)
        axes = ThreeDAxes(x_range=(-3, 3, 1), y_range=(-3, 3, 1), z_range=(-5, 5, 1))
        def param_trig(u, v):
            x = u
            y = v
            z = 2 * np.sin(x) + 2 * np.cos(y)
            return z
        trig_plane = axes.plot_surface(
            param_trig,
            resolution=(resolution_fa, resolution_fa),
            u_range = (-3, 3),
            v_range = (-3, 3),
            colorscale = [BLUE, GREEN, YELLOW, ORANGE, RED],
            )
        self.add(axes, trig_plane)
- point_to_polar(point)[source]
从点获取极坐标。
- 参数:
point (Point2DLike) – 该点。
- 返回:
坐标半径 (\(r\)) 和坐标方位角 (\(\theta\))。
- 返回类型:
Tuple[
float,float]
- polar_to_point(radius, azimuth)[source]
从极坐标获取一个点。
- 参数:
radius (float) – 坐标半径 (\(r\))。
azimuth (float) – 坐标方位角 (\(\theta\))。
- 返回:
该点。
- 返回类型:
numpy.ndarray
示例
示例:PolarToPointExample 

from manim import *

class PolarToPointExample(Scene):
    def construct(self):
        polarplane_pi = PolarPlane(azimuth_units="PI radians", size=6)
        polartopoint_vector = Vector(polarplane_pi.polar_to_point(3, PI/4))
        self.add(polarplane_pi)
        self.add(polartopoint_vector)
class PolarToPointExample(Scene):
    def construct(self):
        polarplane_pi = PolarPlane(azimuth_units="PI radians", size=6)
        polartopoint_vector = Vector(polarplane_pi.polar_to_point(3, PI/4))
        self.add(polarplane_pi)
        self.add(polartopoint_vector)
参考:
PolarPlaneVector
- pr2pt(radius, azimuth)[source]
polar_to_point()的缩写。- 参数:
radius (float)
azimuth (float)
- 返回类型:
ndarray
- pt2pr(point)[source]
point_to_polar()的缩写。- 参数:
point (ndarray)
- 返回类型:
tuple[float, float]
- slope_of_tangent(x, graph, **kwargs)[source]
返回在特定x值处,绘制曲线的切线的斜率。
- 参数:
x (float) – 切线必须与曲线相切的x值。
graph (ParametricFunction) – 用于计算切线的
ParametricFunction。kwargs (Any)
- 返回:
切线与 x 轴的斜率。
- 返回类型:
浮点数
示例
ax = Axes()
curve = ax.plot(lambda x: x**2)
ax.slope_of_tangent(x=-2, graph=curve)
# -3.5000000259052038