BarChart
完整名称:manim.mobject.graphing.probability.BarChart
- class BarChart(values, bar_names=None, y_range=None, x_length=None, y_length=None, bar_colors=['#003f5c', '#58508d', '#bc5090', '#ff6361', '#ffa600'], bar_width=0.6, bar_fill_opacity=0.7, bar_stroke_width=3, **kwargs)[source]
基类:
Axes创建一个柱状图。继承自
Axes,因此共享其方法和属性。每个坐标轴都继承自NumberLine,因此可以传入x_axis_config/y_axis_config来控制它们的属性。- 参数:
values (MutableSequence[float]) – 一个值序列,用于确定每个柱子的高度。接受负值。
bar_names (Sequence[str] | None) – 每个柱子的名称序列。不必与
values的长度匹配。y_range (Sequence[float] | None) – y轴的值范围。如果为
None,则范围将根据values的最小值/最大值计算,步长将根据y_length计算。x_length (float | None) – x轴的长度。如果为
None,则根据值的数量和屏幕宽度自动计算。y_length (float | None) – y轴的长度。
bar_colors (Iterable[str]) – 柱子的颜色。接受一个颜色序列(可以只包含一个项目)。如果``bar_colors`` 的长度与
values不匹配,中间颜色将自动确定。bar_width (float) – 柱子的长度。必须在 0 到 1 之间。
bar_fill_opacity (float) – 柱子的填充不透明度。
bar_stroke_width (float) – 柱子的描边宽度。
示例
示例:BarChartExample 
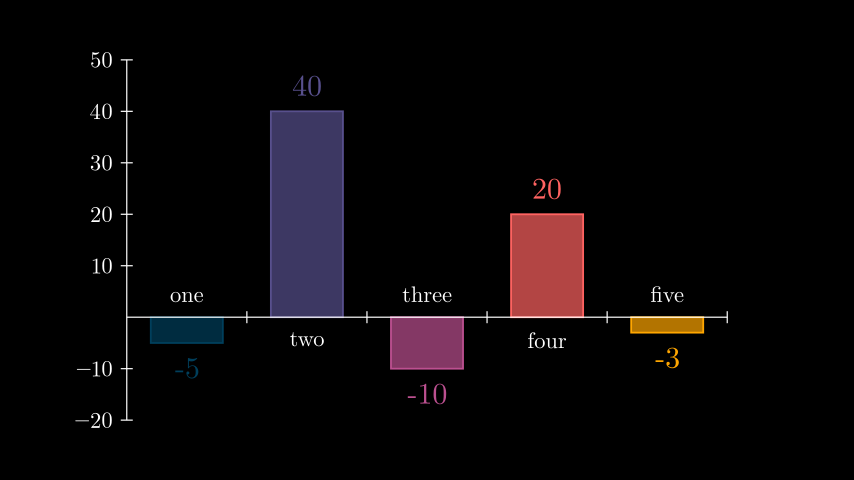
from manim import *

class BarChartExample(Scene):
    def construct(self):
        chart = BarChart(
            values=[-5, 40, -10, 20, -3],
            bar_names=["one", "two", "three", "four", "five"],
            y_range=[-20, 50, 10],
            y_length=6,
            x_length=10,
            x_axis_config={"font_size": 36},
        )

        c_bar_lbls = chart.get_bar_labels(font_size=48)

        self.add(chart, c_bar_lbls)
方法
更新图表中柱子的高度。
用对应的值标注每个柱子。
属性
animate (动画)用于动画化
self的任何方法的应用。animation_overrides (动画覆盖)颜色depth (深度)mobject 的深度。
fill_color (填充颜色)如果存在多种颜色(用于渐变),则返回第一种颜色
height (高度)mobject 的高度。
n_points_per_curve (每条曲线的点数)sheen_factor (光泽因子)stroke_color (描边颜色)width (宽度)mobject 的宽度。
- _add_x_axis_labels()[source]
本质上是 :meth:`~.NumberLine.add_labels`,但不同之处在于标签相对于 x 轴的方向会根据值改变为 UP(上)或 DOWN(下)。
负值时为 UP(上),正值时为 DOWN(下)。
- _create_bar(bar_number, value)[source]
在图表上创建一个定位的柱子。
- 参数:
bar_number (int) – 决定柱子的 x 位置。
value (float) – 决定柱子高度的值。
- 返回:
一个表示图表上柱子的定位矩形。
- 返回类型:
- _original__init__(values, bar_names=None, y_range=None, x_length=None, y_length=None, bar_colors=['#003f5c', '#58508d', '#bc5090', '#ff6361', '#ffa600'], bar_width=0.6, bar_fill_opacity=0.7, bar_stroke_width=3, **kwargs)
初始化自身。有关准确签名,请参阅 help(type(self))。
- 参数:
values (MutableSequence[float])
bar_names (Sequence[str] | None)
y_range (Sequence[float] | None)
x_length (float | None)
y_length (float | None)
bar_colors (Iterable[str])
bar_width (float)
bar_fill_opacity (float)
bar_stroke_width (float)
- _update_colors()[source]
初始化图表中柱子的颜色。
通过
self.bar_colors设置self.bars的颜色。主要用于通过
self._add_bars初始化柱子或通过self.change_bar_values更新柱子时。
- change_bar_values(values, update_colors=True)[source]
更新图表中柱子的高度。
- 参数:
values (Iterable[float]) – 用于更新柱子高度的值。不必与柱子的数量匹配。
update_colors (bool) – 是否根据
self.bar_colors重新初始化柱子的颜色。
示例
示例:ChangeBarValuesExample 
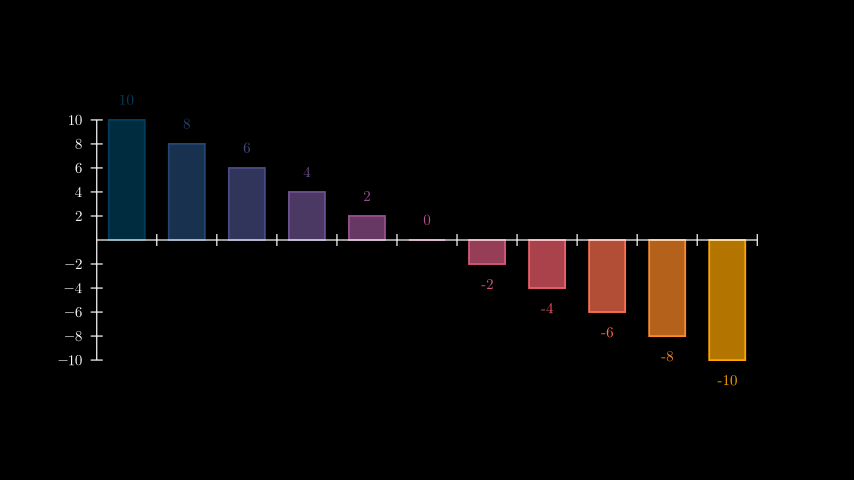
from manim import *

class ChangeBarValuesExample(Scene):
    def construct(self):
        values=[-10, -8, -6, -4, -2, 0, 2, 4, 6, 8, 10]

        chart = BarChart(
            values,
            y_range=[-10, 10, 2],
            y_axis_config={"font_size": 24},
        )
        self.add(chart)

        chart.change_bar_values(list(reversed(values)))
        self.add(chart.get_bar_labels(font_size=24))
- get_bar_labels(color=None, font_size=24, buff=0.25, label_constructor=<class 'manim.mobject.text.tex_mobject.Tex'>)[source]
用对应的值标注每个柱子。创建后使用
self.bar_labels访问标签。- 参数:
color (ParsableManimColor | None) – 每个标签的颜色。默认为
None,并基于父柱子的颜色。font_size (float) – 每个标签的字体大小。
buff (float) – 每个标签到其柱子的距离。默认为 0.4。
label_constructor (type[VMobject]) – 用于构造标签的 Mobject 类,默认为
Tex。
示例
示例:GetBarLabelsExample 
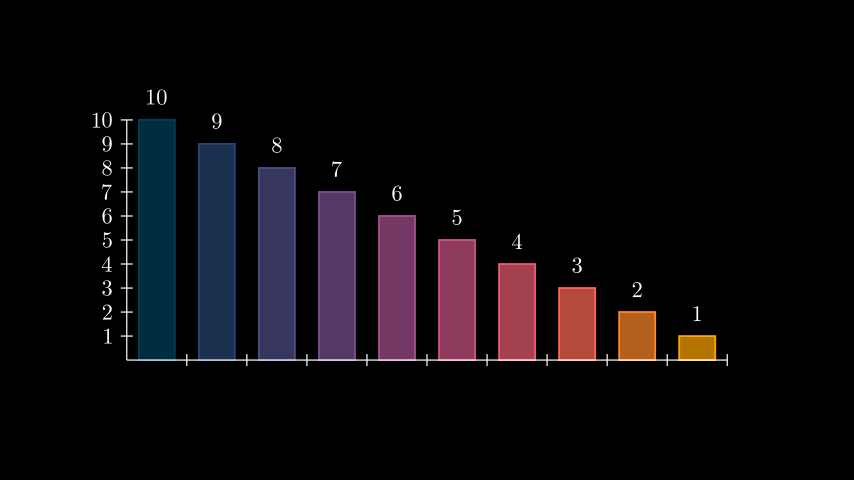
from manim import *

class GetBarLabelsExample(Scene):
    def construct(self):
        chart = BarChart(values=[10, 9, 8, 7, 6, 5, 4, 3, 2, 1], y_range=[0, 10, 1])

        c_bar_lbls = chart.get_bar_labels(
            color=WHITE, label_constructor=MathTex, font_size=36
        )

        self.add(chart, c_bar_lbls)
class GetBarLabelsExample(Scene):
    def construct(self):
        chart = BarChart(values=[10, 9, 8, 7, 6, 5, 4, 3, 2, 1], y_range=[0, 10, 1])

        c_bar_lbls = chart.get_bar_labels(
            color=WHITE, label_constructor=MathTex, font_size=36
        )

        self.add(chart, c_bar_lbls)